Algorand targetsI took a measured move from each local bottom to local top for the last 4 "pumps" we've seen since the big pump in February. I placed these four lines on our new local bottom to get an idea of what to expect from this next 30 day cycle.
If we are to expect algorand to make a move similar to the last four it has made, we should see a local top between $1.12 and $1.46, and I would say that sub $1.20 is more likely than above it.
NFA.
ALGOUSD trade ideas

ALGO - Detailed Video Analysis!Hello everyone, if you like the idea, do not forget to support with a like and follow.
Here is the top-down analysis for ALGO, feel free to request any pair/instrument or ask any questions in the comment section below.
Best of luck!

Algo is very consistentOver the last 5 months algorand has been following this bottom pattern. The local lows are all 30 days apart from each other, except one which is 29 days.. Yesterday was the 30 day bottom, so we can conclude that, if the trend continues, 30 days from now is the next new bottom.
Additionally, from local bottom to local top, all 4 cycles have increased over 65%. I'm going to put my money on algo repeating the cycle yet again. Even if it is a lower high, it is possible to reach 1.26 in the next 3 weeks.
DYOR, NFA.

#Algo big moment ahead If Algorand falls too .722 it'll be bearish reversal time. So let's try & stay above that mark if we are able too then we may stay Bullish moving into tomorrow.
*Not Financial Advice

AlgorandAlgorand price prediction for buying oppurtunities. will be looking for a bullish impulse to previous high created at the least, longterm hold.


Incredible buy opportunity Hugely undervalued and a ways to makeup. Momentum in its direction cushioned by btc


ALGOUSD You like ALGO? Grab it at about 40 cents! Triple Confluence with fibs right now at S/R close to 40 cents.
In a huge bear flag after big distribution pattern.
Embrace the bears and cheap Algorand!

If #Algo drops below $1 it may be a very strong Buying Opp.As you see here I expect us to dip back to $1, now once we hit that point we need to look for 2 things
First we need to see if we'll do a Touch & Go at $1 or if we will break that resistance leading to the .90 range. If Bitcoin picks back up leading into the week we may break the $1.10 resistance and be on our way towards $1.50 by next weekend.
*Not Financial Advice

ALGO Fractal is still in play: Updated VersionSo i was wrong about the fractal last time, but i am not giving up - are you?
I am still very bullish on algorand future and the fact that Algorand push back above 1$ is a good sign.
And based on my expectation we should be at $2 by end of JUNE.
I hope you are guys are with and chasing less memes and more real assets.
Real Tech, Real Team, Real Adoption.
Let's see some of the algo recent news:
yieldly.finance
decrypt.co
cointelegraph.com
www.algorand.com
arcc.one
www.bitfinex.com
So today i present to you an updated version with same fractal intact and i hope this time around it is going to be a lot more accurate.
__FRACTALS__
Lots of fractals this summer
__REVIEW__
So the fractal started pretty good, but unfortunately on May 17 fractal diverted, and on MAy 19 it became obvious to everyone the A-E was too eager. The D-E was going to be another deeper drop, and going to match the December Fractal a lot closer. Again we can thank BTC and ELON for this Plus CHINA.
Fundamentals have not changed for ALGORAND at all, so it is unfortunate that this happened, but those who became bag holders, or early investors are stuck again HOLDing their asset, at least unlike many other alts, algo pays very nice daily reward :)
The Key was counting A C and E as sub $1 supports , remember how i talk about holy trinities in crypto markets. Well i guess, this is it for ALGO at 70-80 support.
It is sad to see your expectation fail, but luckly we are still in the game and Algo will prove that we are still right about it in the long term
-----------------------------------------
**LEGENDS**
BLUE = Bear/Resistance || Yellow = Bull/ Support
Lines: Fractal dates are moments of interest, where price and time collide to create oscillation.
the chart for possible scenarios of price actions - use zoom and scroll for better view.~
/*This information is not a recommendation to buy or sell. It is to be used for educational purposes only.*/
Feel free to request: your coin to be analyzed! Please keep those Stop losses in place or mind!
Thank you, and stay strong my fellow CryptoPunks!
Future belongs to the brave, and crypto is the future.
_Ajion
Please checkout my new beta product at : ajion.co/future - where you can see and trade with fractal power!

ALKALINE PORTFOLIO - ALGOThis will be our Alkaline Free Crypto Portfolio. This portfolio will be held for the long term, so you must manage your capital to deal with potential dips in the crypto market. We will not provide every entry in one post, as we believe in the power of dollar-cost averaging. Leverage is not allowed, this portfolio must be followed by a Spot wallet.
Our analysis will be provided with an approximate entry price and the name of the token.
All the ideas provided must be taken with the same capital so that the performance is similar to the CryptoAlkaline portfolio.
You must divide your capital into entries of 2-5%. For example, a $10k bag will place entries of $200-$ 500, and in case of running out of money from the allocated capital, new entries must be taken with the same size.
It has been proven that the cryptocurrency market follows the same direction most of the time and that in this case, diversification does not eliminate the risk of losing money. However, we rely on diversification as a tool to increase our exposure to sporadic hikes in certain Altcoins.
Understand the risks involved in buying cryptocurrencies, and execute these activities legally according to the regulations of your country.
------------------------------------------------------------------
NEW ENTRY in Algorand (ALGO/USD // ALGO/USDT)
ENTRY PRICE $ 1.06
NO LEVERAGE, NO TARGETS
Please read our "Free Crypto Portfolio Rules" before placing your positions.
From a technical view, Algorand is respecting the $1 psychological level, and the Daily 200 EMA. Also, it seems that Algorand is not too vulnerable to Bitcoin retracements.
This token has a use case for instant payments with low commissions and rewards through staking. Several payment processors such as Visa & Mastercard have shown interest in this asset. This fact causes the $1 level to be detected as a good buying opportunity, as it is considered reasonable for a token that could be used to pay for goods and services.
Good luck, Alkalites!

#ALGO may see a push towards $1.50The market is green right now, we may see a nice push up too $1.50 if this momentum continues and the Volume picks up. There is a bunch of Positive news around Algorand right now, more and more projects and integration into Cities and Businesses every single day.
*Not Financial Advice

#ALGO building Momentum As you see we just touched the lower band followed by an engulfing green candlestick which is a great sign for a bull push towards the top of this wedge pattern.
We'll need to see the Volume pick up if were expecting to break out of this wedge & get on a Bullish Run. If BTC continues to dip over the next 24 hours then we may not break through the top resistance, but I will keep you posted as we move through the night.
*Not Financial Advice

Algo overanalyzed supports and resistanceBig position rn so wanted to be thorough. Has held very strong theiughout this crash. Makes me lean towards the bull towards 1$, to 1.12$, and based on the market, either see a fall back to support lines or a way up to 1.5 to even 1.8.

Algorand (ALGO) - June 15Hello?
Welcome, traders.
By "following", you can always get new information quickly.
Please also click "Like".
Have a good day.
-------------------------------------
(ALGOUSD 1W Chart)
If the price holds above the 0.76754798 point, we expect the uptrend to continue.
(1D chart)
We need to see if we can move higher from the 0.92350974-1.18903235 zone and move above the downtrend line.
If it finds support by moving up to the 1.18903235-1.32179365 section, it is expected to lead to further upside.
However, if it declines, it is expected that the downward trend will continue, so careful trading is required.
-------------------------------------
(ALGOBTC 1W chart)
To create a new wave, it must rise above the 4309 Satoshi point.
It remains to be seen if support at the 2452 Satoshi point can be found and continue the uptrend along the uptrend line.
If it falls below the 1970 Satoshi point, it may take a long time to rise as it enters the mid- to long-term investment area.
Therefore, careful trading is required.
(1D chart)
It remains to be seen if we can climb to the 2792 satoshi-3000 satoshi section.
If it falls from the 2374 Satoshi point, Stop Loss is required to preserve profit and loss.
If it does not fall below the downtrend line, it is likely to rise, so careful trading is required.
------------------------------------------
We recommend that you trade with your average unit price.
This is because, if the price is below your average unit price, whether it is in an uptrend or in a downtrend, there is a high possibility that you will not be able to get a big profit due to psychological burden.
The center of all trading starts with the average unit price at which you start trading.
If you ignore this, you may be trading in the wrong direction.
Therefore, it is important to find a way to lower the average unit price and adjust the proportion of the investment, ultimately allowing the funds corresponding to the profits to regenerate themselves.
------------------------------------------------------------ -----------------------------------------------------
** All indicators are lagging indicators.
Therefore, it is important to be aware that the indicator moves accordingly with the movement of price and volume.
However, for the sake of convenience, we are talking in reverse for the interpretation of the indicator.
** The wRSI_SR indicator is an indicator created by adding settings and options to the existing Stochastic RSI indicator.
Therefore, the interpretation is the same as the traditional Stochastic RSI indicator. (K, D line -> R, S line)
** The OBV indicator was re-created by applying a formula to the DepthHouse Trading indicator, an indicator disclosed by oh92. (Thanks for this.)
** See support, resistance, and abbreviation points.
** Support or resistance is based on the closing price of the 1D chart.
** All descriptions are for reference only and do not guarantee a profit or loss in investment.
Explanation of abbreviations displayed in the chart
R: A point or section of resistance that requires a response to preserve profits.
S-L: Stop Loss point or section
S: A point or section where you can buy to make a profit as a support point or section.
(Short-term Stop Loss can be said to be a point where profit and loss can be preserved or additional entry can be made through split trading. It is a short-term investment perspective.)
GAP refers to the difference in prices that occurred when the stock market, CME, and BAKKT exchanges were closed because they are not traded 24 hours a day.
G1 : Closing price when closed
G2: Opening price
(Example) Gap (G1-G2)

ALGO/USDPrice retested market structure and got rejected from demand zone and 61 Fibo.
I think we can see $3 easy in the end of the bull market.
Bullish on #ALGO
DYOR

ALGOUSD: Moonboi EditionThis not to be taken as financial advice as I attempt to lay out what I personally see as the "best possible" scenario for an Algorand bull in 2021. I have it topping out late in the year around $5 before a descent back to the $2s. Now, there are so many bullish catalysts for Algorand right now but there is also the possibility for extremely bearish catalysts (regulation, crash, actual bear market confirmation, etc). Good luck to all.


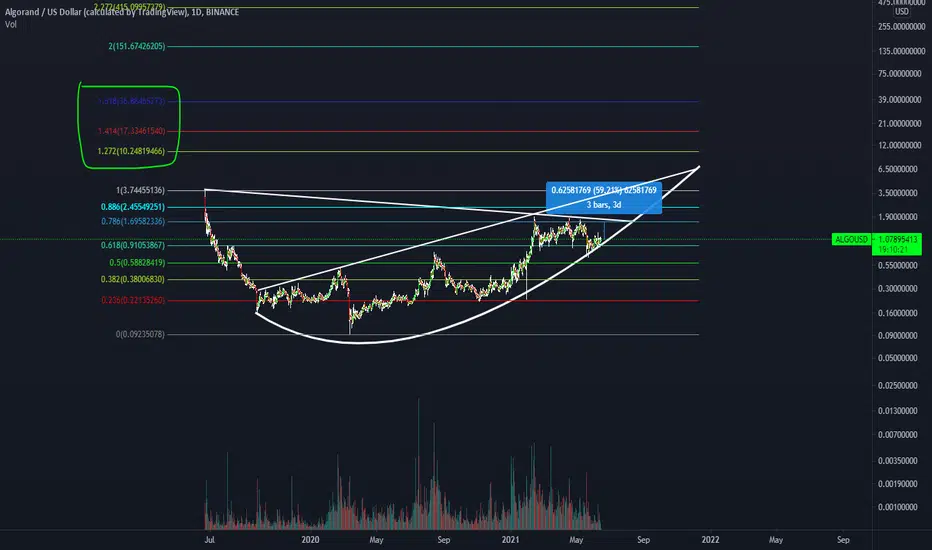
ALGO next 2 monthsAlgo has formed an inverse head and shoulders pattern and in the semi-longterm will rise to around the fib level 4 over the the next 2 months. There's a possible entry point around the 1.272 to the 2 fibonacci support levels in the near term before we head to around $1.64. That should give you a shot at a 96-100% return so look out for it.

$4.77 Target for AlgoLike all of crypto... Algo has had a massive wave 4 pullback as the market was over extended, but as we look at the charts we can see that the STOCH RSI on the weekly is as low as it can go and basically on the floor. If BTC can start to recover in the coming weeks and get above $42k then we should see an ALT rally in July and Aug and this should lead us through wave 5 and Fib 2.618 target around $4.77 for Algo. The key is BTC continuation and ALT rally and we should be golden for Algo.
Not financial advice.

Possible small gain on a flat marketThe ALGO market is going sideways at the moment, but there is a chance for a small profit over the next few days.
The weekends are normally fairly flat, so, in an already flat market, I don't expect anything wild to happen
TP1: $1.16
TP2: $1.28 (but I don't see us breaking the 0.236 fib)
I won't use a stop loss as I trust the long term project, but I would probably set one around $0.95
