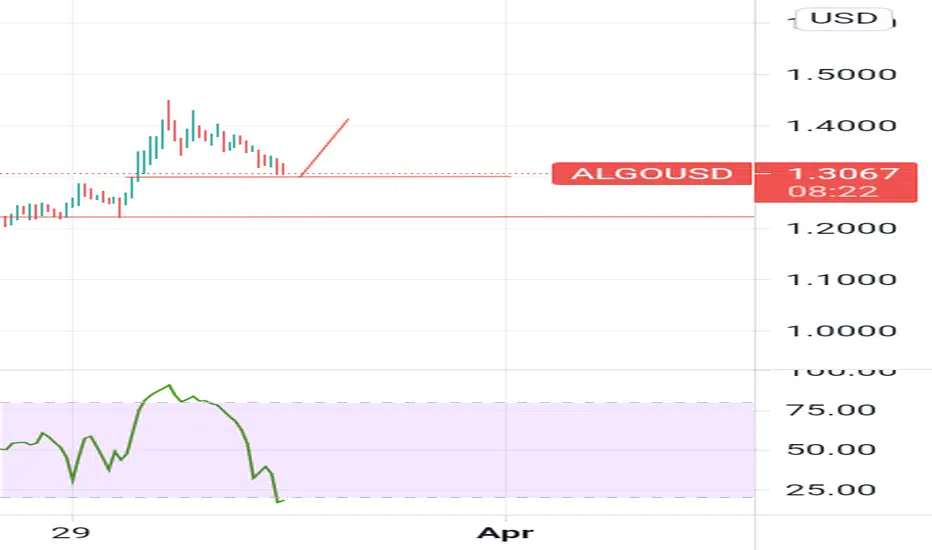
Small downward channel up against fib lineWe're in a small downward channel right now, and we should bounce off the .382 fib line as well as that green line of support. It may re-test the top of the channel, but as it's getting squeezed, we should see a break out testing $1.47 with $1.35 as new low support
ALGOUSD trade ideas


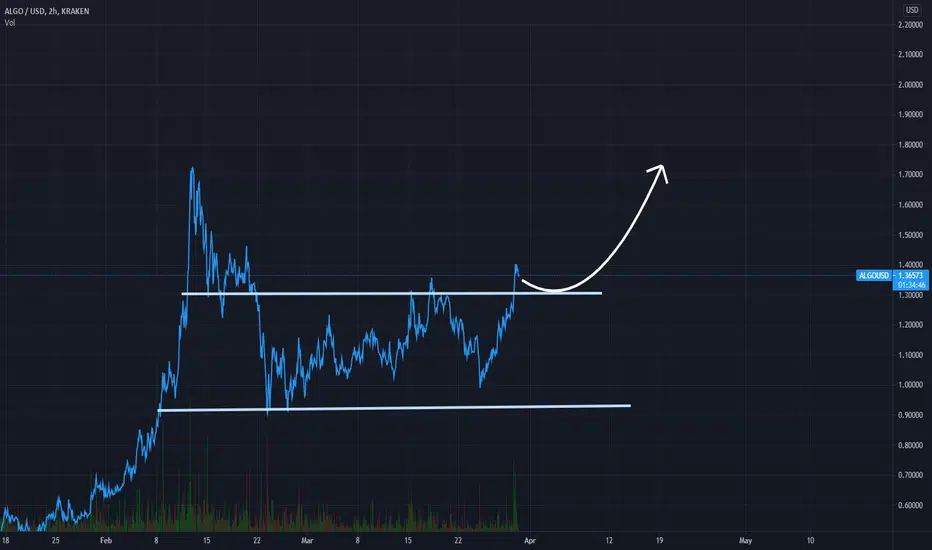
ALGOUSD inverse HEAD AND SHOULDERS?Algo looks like it is creating an inverse head and shoulders pattern. Lets see if it will complete the yellow line and break the neck line labeled with the purple arrow. If we can break out of this and the channel we can see us at our local high around $1.84. We can also view it as a cup and handle possibly
I like to keep my ideas short, brief, clean and clear right to the point. Do you own research. Good luck and happy trades this is not trading advice

Algorand small analysis noob learning. There are two different types of people in the world, those who want to know, and those who want to believe.
Friedrich Nietzsche

Algo 1hrMf oversold on support . I dont think it will go below but watch for a wickdown
. Not a rexomebdation.
Poised for a Breakout w/Algo!!!!Chart says it all. We are poised for a breakout on the hourly, all these wicks keep getting filled. ALGO TO LE MOOOOOON KRAKEN:ALGOUSD
TP1 - 2$
SL - None
Leverage - 10x
Broker - FTX

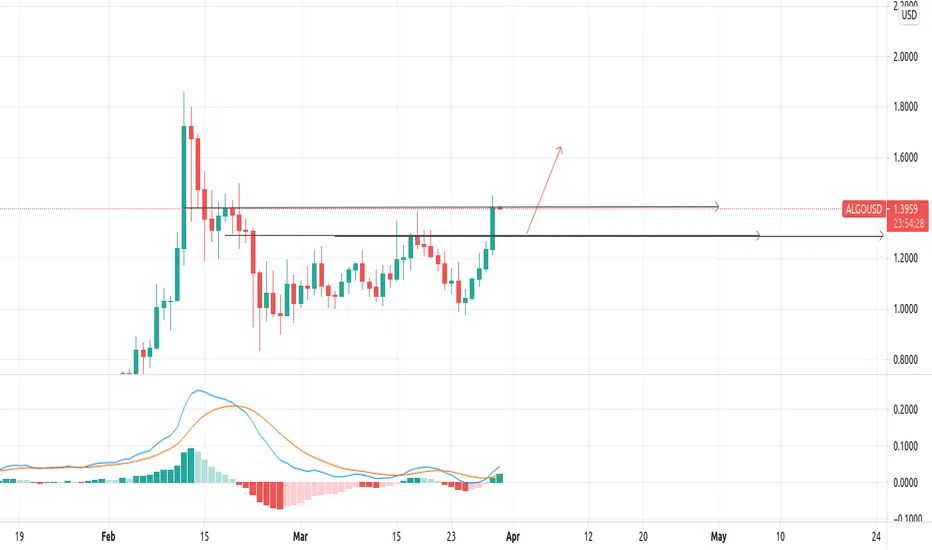
ohhhhhhhhhhhhhhhhhhhh ALGOAlgorand seems to building quite a beautiful structure for take off. Got rejected at the pesky $1.4 resistance- wicked above but didn't close above. If and when we close above the $1.4 level we should be on track to smash past the previous local high.
Just my 2 cents!

ALGO USD pennant, bullish continuationAfter breaking out a couple days ago, ALGO is consolidating for another leg up. If not already long, wait for confirmation of entry.

ALGO (ALGOPERP) – Long signalBUY: 1.12 – 1.18 (Wait for price to reclaim the EMAs before entering)
TARGETS:
1) 1.44
2) 1.77
STOP: When a 4h candle closes below 0.98
Rationale:
-The 100 and 200 EMA have acted as strong support for the duration of the uptrend.
-More recently, the price has been conforming to an ascending channel.
-The RSI has also been moving in a channel and is at a key support/resistance level.
-If the RSI can break and hold above the channel it should also hold above the 200EMA. This is our signal to enter a long position.
-The confluence with the 200EMA and RSI gives us confidence in taking a long position once the EMA is reclaimed as support.
Your risk, your reward. This is not financial advice.
Happy trading.

Algorand (ALGO) - March 30Hello?
Dear traders, nice to meet you.
By "following" you can always get new information quickly.
Please also ask for the "Like" clock.
Have a nice day.
----------------------------------
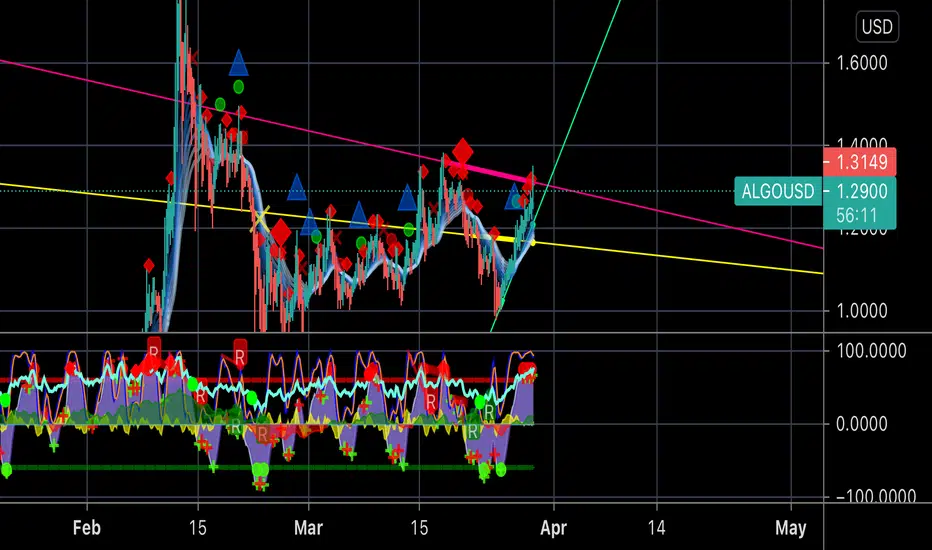
You should watch for any movement that deviates from the 1.35677473-1.47009413 section.
If it goes down, you need to make sure you get support at 1.32179365.
If you fall at the 1.18903235 point, you need a short stop loss.
However, it may rise along the uptrend line, so careful trading is necessary.
We'll get support at 1.47009413 and see if we can climb above 2.11836146.
In the CCI-RC indicator, it remains to be seen whether the CCI line can break above the EMA line.
---------------------------------------
(ALGOBTC 1D chart)
We need to see if we get support at the 2374 Satoshi spot and see if it breaks off the downtrend line.
The next volatility period is around April 7.
-------------------------------------------------- -------------------------------------------
** All indicators are lagging indicators.
So, it's important to be aware that the indicator moves accordingly with the movement of price and volume.
Just for the sake of convenience, we are talking upside down for interpretation of the indicators.
** The wRSI_SR indicator is an indicator created by adding settings and options from the existing Stochastic RSI indicator.
Therefore, the interpretation is the same as the conventional stochastic RSI indicator. (K, D line -> R, S line)
** The OBV indicator was re-created by applying a formula to the DepthHouse Trading indicator, an indicator that oh92 disclosed. (Thank you for this.)
** Check support, resistance, and abbreviation points.
** Support or resistance is based on the closing price of the 1D chart.
** All explanations are for reference only and do not guarantee profit or loss on investment.
Explanation of abbreviations displayed on the chart
R: A point or section of resistance that requires a response to preserve profits
S-L: Stop Loss point or section
S: A point or segment that can be bought for profit generation as a support point or segment
(Short-term Stop Loss can be said to be a point where profits and losses can be preserved or additionally entered through installment transactions. It is a short-term investment perspective.
GAP refers to the difference in prices that occurred when the stock market, CME, and BAKKT exchanges were closed because they do not trade 24 hours a day.
G1: Closing price when closed
G2: Cigar at the time of opening
(Example) Gap (G1-G2)

algo ideatook some profits at 1.42 holding the rest for 1.72 i think algo looks solid on the daily but getting overbiught, current daily resistance at 1.40 and support at around 1.30. i think it should keep going up after a minor retrace


Algo - Head and Shoulder (Bearish) FormingHead and Shoulder bearish pattern beginning to form on Algo. Could signal a drop past current support.
