ALGOUSDTALGO ~ 1W
#ALGO If you still have Conviction on this coin,. This support block would be a very good buying place for now,. with a minimum target of 20%++
ALGOUSDT trade ideas

$algo- erase the sorrow in 1 engulfing opened up a decent position here no stop for now
keep it running till 48c then reasses
likeky goes crazy once we do so best risk reward and time is NO imo
rsi curled up H4 200 reclaim pending..
carpe d

ALGOUSDT.4HExamining the ALGO/USDT 4-hour chart, I observe several important features and indicators that provide insights into the current market behavior and potential future movements.
Key Observations:
Resistance Levels: The chart points to a key resistance at 'R1' ($0.1122). This level has previously acted as a barrier, and surpassing it could signal bullish momentum. 'R2' at $0.1330 is the next significant resistance if 'R1' is breached.
Support Levels: The chart does not specify current support levels below the last visible price, but it's critical to note the descending resistance line which has been acting as a dynamic resistance level. A break above this line could be indicative of a trend reversal.
Price Trend and Movement: The price appears to be consolidating with potential attempts to breach the descending resistance line, indicating a pivotal market sentiment phase.
Technical Indicators:
Stochastic RSI: The Stochastic RSI is approaching the oversold region, suggesting potential for a price reversal or at least stabilization, which might provide a buying opportunity.
MACD: The MACD is currently below the signal line, indicating bearish momentum. However, the histogram suggests the bearish momentum is weakening, which could precede a bullish crossover if the trend continues.
Strategic Approach: Given the proximity to the descending resistance line and the technical indicators suggesting potential shifts, I would closely monitor ALGO for a possible breakout above this line. A confirmed breakout, especially with an accompanying bullish MACD crossover, could validate entering a long position targeting 'R1' and potentially 'R2'.
Alternatively, if the price fails to break the resistance line and declines, it will be essential to identify new support levels to reassess entry and exit points. This could mean setting up buy orders near historically significant support levels or areas where the price has shown resilience in the past.
Conclusion: The ALGO/USDT pair is currently showing signs that could either lead to a breakout or further consolidation. Traders should be vigilant and look for confirmation of direction through additional indicators and volume analysis. Entering trades should be considered cautiously with tight stop-losses to manage risk effectively, especially given the current uncertain market conditions. As always, maintaining a disciplined approach to risk management is crucial to navigating the markets effectively.

ALGORAND ROCKET SHIP!!I believe Algorand has bottomed in the way of a bullish shark or cypher pattern. I've outlined entry and exit points. I have accumulated a crap ton of Algo. I just wanted to let you all know. Now you do what you want with this info. Good luck

Long ALGOEntry1:
Demand zone: 0.119 considering where the price stopped before.
The entry would be right beneath recent lows. Here, we probably have a lot of SLs, but it's also possible to have breakout shorts. A direct entry without some confirmations on LTF is riskier.
SL: right below the last doji.
TP: on a further away Supply zone that coincides with fib 0.5, or the middle of the range if we consider price action on HTF to be a range.
Entry2:
Demand on the wick of the last doji, also a support zone.
SL: beneath the support
TP: We can have this trade as an HTF play, still in the range. We're betting on a reversal on the H1TF.

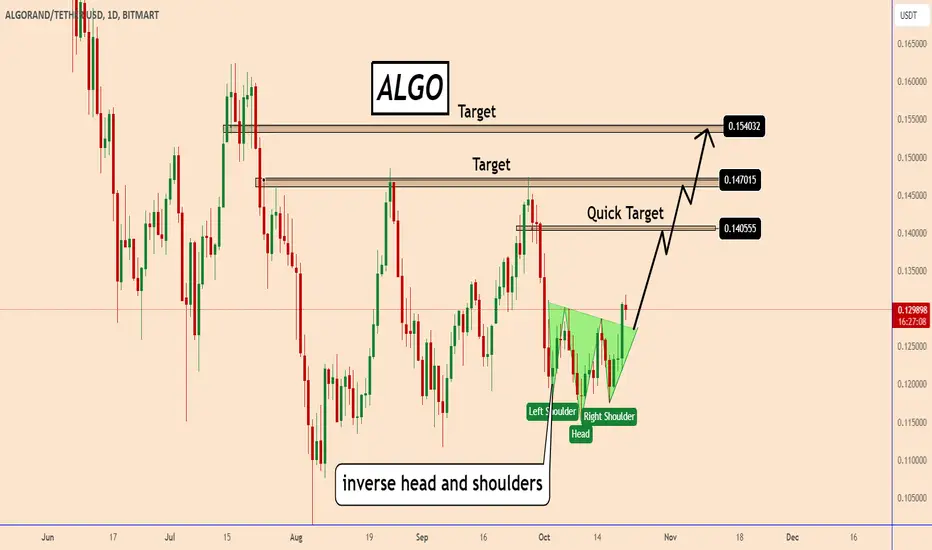
ALGO: Inverse Head and Shoulders Pattern- Bullish SignalALGO: Inverse Head and Shoulders Pattern Signals Bullish Short-Term Trend
ALGO has completed an inverse head and shoulders pattern on the 4-hour chart, suggesting a potential resumption of the bullish short-term trend. The daily chart also shows a strong bullish candle closing above the neckline of the pattern, indicating further growth.
The first target and resistance zone is found near 0.1400, but there's potential for the movement to extend to 0.1470 and 0.1540.
You may find more details in the chart!
Thank you and Good Luck!
❤️PS: Please support with a like or comment if you find this analysis useful for your trading day❤️

ALGOUSDT 1H - TRIANGULAR ZoneALGOUSDT 1H - TRIANGULAR Zone
If you like my AT, and you agree with the approaches, please FOLLOW ME and press BOOST so we can share it with more people. We are working on an automated Trading tool so that everyone can apply their strategies VISUALLY and PROFESSIONALLY, as we present in the analysis.
Thank you!
____________________________________________________________________
ALGOUSDT 1H - TRIANGULAR Zone
ALGORAND is in a price consolidation zone.
LEVELS:
SL: 0.14
Resistance 0.14
TP: 0.16
In the range 0.11 - 0.16 we can do SWING TRADING as long as it does not lose the SL. At the moment we are close to the BUY ZONE.
Above 0.16 we can set other objectives.
_____________________________________________________________________
Crypto Trading Automated Bots:
All these strategic alternatives can be configured with TradeX BoT, as it will allow you to position in both directions without having to block any amount per position. It will only be necessary for the conditions to be met, either downwards or upwards, for the orders to be executed in one direction or the other, taking the necessary deposits from your portfolio.
TradeX BoT (in development): Tool to automate trading strategies designed in TradingView. It works with both indicators and technical drawing tools: parallel channels, trend lines, supports, resistances... It allows you to easily establish SL (%), TP (%), SL Trailing... multiple strategies in different values, simultaneous BUY-SELL orders, conditional orders.
This tool is in the development process and the BETA will soon be ready for testing.
FOLLOW ME and I will keep you informed of the progress we make.
I share with you my technical analysis assessments on certain stocks that I follow as part of the strategies I design for my portfolio, but I do not recommend anyone to operate based on these indicators. Get informed, educate yourself and build your own strategies when it comes to investing. I only hope that my comments help you on your own path :)

Trade Idea - Long - Do not miss it !!!!It is on Key level. 8.65 RR. Big Risk to reward ratio.
TP already mentioned. Book your profit accordingly. If TP 1 hit, move your SL to breakeven.
Stop loss is small.
Do not miss.
Best of luck. Thanks.

Algorand Set To Enter Long-Term Accumulation ZoneIt seemed like Algorand ended its correction but nope, a rejection is present right at EMA34 last week, and this week a move (and soon close) below EMA13, pointing toward another low next.
The drop that happened in early August 2024 did activate the October/September 2023 low prices, but the pair still produced a higher low. It seems we will get another drop which will activate the long-term accumulation zone. When prices drop, this will be the last chance to buy cheap and accumulate in anticipation of the 2025 major bull-market.
We are expecting new All-Time Highs and major growth in 2025. It will get ugly when the climax of the correction is happening but remember, this is only a temporary event and only has a few weeks, a few months at max, left.
Once the correction is over we can focus on green and up, we will never look back again. We will rebuild from the grown up. There will be lots of damage, but we are prepared, we know what to expect; life goes on.
Namaste.

Algorand (ALGO): CME Gap Has Not Been Filled / Possible 15% MoveAlgorand seems good to short soon where the 2nd moving average has shown us a second attempt at a switch in trend and an unfilled CME gap is just sitting there on lower zones waiting to be filled!
Possible good setup might come from here so eyes wide open here!
Swallow Team

ALGOUSDT : The prospect of increasing?As you can see, ALGO has created an ascending head and shoulders and is also located in the Falling wedge , which means that if it breaks, we expect the price to reach the target (AB=CD).
✨We spend hours finding potential opportunities and writing useful ideas, we would be happy if you support us.
Best regards CobraVanguard.💚
_ _ _ _ __ _ _ _ _ _ _ _ _ _ _ _ _ _ _ _ _ _ _ _ _ _ _ _ _ _ _ _
✅Thank you, and for more ideas, hit ❤️Like❤️ and 🌟Follow🌟!
⚠️Things can change...
The markets are always changing and even with all these signals, the market changes tend to be strong and fast!!

ALGOUSDTALGOUSDT is in strong bullish trend.
As the market is consistently printing new HHs and HLs.
currently the market is retracing a bit after last HH, which is also the 50% Fib retracement level and local support as well. if the market successfully sustain this buying confluence the next leg up could go for new HH.
What you guys think of this idea?

Target 0.165Following weekly chart and got a long signal ( actually yesterday) from my screener.
TP1 0.154
TP2 0.165
SL Not a super ratio but close under 0.123 weekly close.

ALGO Long Spot Position (Descending Resistance Breakout)Market Context: ALGO has recently broken through the descending resistance line from May and is now at support, presenting a long trade opportunity.
Trade Setup:
Entry: Ladder into a long position in the $0.13 - $0.1380 support area.
Take Profit:
First target: $0.16 - $0.17
Second target: $0.20 - $0.2170
Stop Loss: Just below $0.123
⚡ This setup aims to capitalize on the breakout and current support level.
#ALGO #Crypto

#ALGO/USDT#ALGO
The price is moving in a descending channel on the 1-hour frame and is sticking to it to a large extent and is expected to break it upwards
We have a bounce that was booked from the lower limit of the channel at a price of 0.1200
We have a downtrend on the RSI indicator which supports the rise
We have a trend to stabilize above the moving average 100
Entry price 0.1210
First target 0.1250
Second target 0.1300
Third target 0.1344

ALGOUSDT Another Bearish patternI remember that i bought some of this coin for more than 0.30 cents hopping for a move to $1 bucks in long term, however it was a dream of a naive sucker to hold this shitcoin as lon as it came to nearly 0.10 cents per coin, if i would've bought sheep's dung i would've been profitted much much higher than this abomination
i don't feel sorry for myself duo to i was naive and it was almost 2 years ago and it was only around 100 bucks, but i feel sorry for those who bought a ton hopping for a rise to 1 bucks so, yeah sorry i was an inexperience crying baby to buy n hold that
Alikze »» ALGO | Ascending corner pattern🔍 Technical analysis: Ascending corner pattern
- It is moving in a downward channel in the daily time frame.
- It was mentioned in the analysis presented in the previous post, after the failure of the supply zone, it will have the ability to continue the trend until the next supply zone. But it faced selling pressure in the first supply area, which led to a correction of 0.23 from the previous wave.
-Currently, it is in a corner pattern, which after the break of the channel, a pullback to the roof of the descending channel has been done.
- Also, with the support of dynamic trigger, it can lead to escape from density.
- Therefore, by leaving the density, it will have the ability to reach the specified goals and also the supply area.
💎 Alternative scenario: In addition, if it faces selling pressure in the area of the high dynamic trigger and does not have a correction in the form of a soft landing, it can continue to correct up to the range of 0.097 with the failure of the low dynamic trigger.
💎 Note: If Fibo 0.23 is not maintained and below the stabilization zone, the bullish scenario will be invalidated and should be reviewed and updated.
»»»«««»»»«««»»»«««
Please support this idea with a LIKE and COMMENT if you find it useful and Click "Follow" on our profile if you'd like these trade ideas delivered straight to your email in the future.
Thanks for your continued support.
Best Regards,❤️
Alikze.
»»»«««»»»«««»»»«««
BINANCE:ALGOUSDT

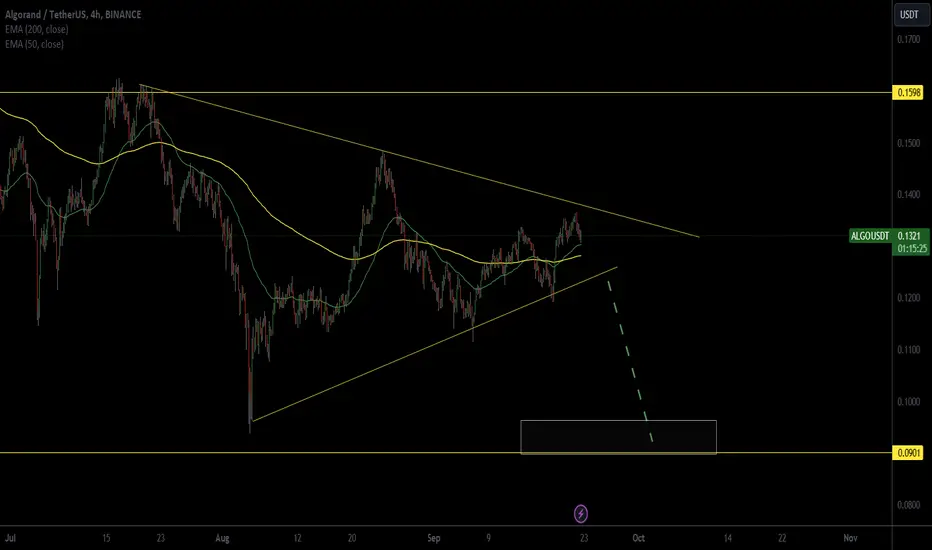
ALGO May Rise After Two Weeks of AccumulationALGO May Rise After Two Weeks of Accumulation
Since August 27, 2024, ALGO has been moving down within a descending pattern.
The recent breakout above this pattern suggests a potential bullish movement, which could drive ALGO back to its previous highs, as illustrated in the chart.
A minor correction is anticipated before the price resumes its upward trajectory.
This correction may occur ahead of the US CPI data release, given the current market speculation.
You may find more details in the chart!
Thank you and Good Luck!
❤️PS: Please support with a like or comment if you find this analysis useful for your trading day❤️

ALGO/USDT Secondary trend. Wedge is a trend. 11 2023Logarithm. Time frame 3 days. Linear price graph for clarity of this beauty.
The entire secondary trend is a falling wedge , a decline in price from the highs to date for 718 days (24 months, or almost 2 years). Volatility has decreased to a minimum, the price is conditionally squeezed, in the near future there may be an excess of supply/demand and a breakthrough of this long-term formation will occur. A pump impulse for a breakthrough due to super “dead faith” and rather low liquidity (price slippage) can be significant.
Decline from the low (liquidity) -96.66%.
We are in the zone of so-called capitulation (on the cryptocurrency itself).
Also, the chart shows conditionally maximum average (from the average price) potential targets of market phases:
1) “participation” (development of the bullish trend to the reset zone, i.e. distribution).
2) Distribution.
Unfair market competition by large market participants.
Prices now, it is about 0.1$, which is the price of “large capital” that “invested” in this crypto project. But, they sold out long ago on the first listings..... After all, the crowd was “sold” at the ICO at an average of about 2.5$ per coin, or even more expensive by the method of divorce with the Dutch auction. That is roughly speaking it is +25X (+2500%).
Dutch auction (in the classical sense) is a type of bidding, at the beginning of which the highest price for the lot is announced, which gradually decreases; the participant who was the first to stop the price decrease becomes the winner.
Bullish cycle 2020-2021.
Then after a dump to the 2020-2021 set zone (0.25$ average) in the bull cycle managed to pump and form a distribution (reset) zone of more than +1000%. From that reset zone and formed this truly huge downward wedge, just like on EOS.
So, this cryptocurrency "changed speculative hands" many times (huge dump/dump volatility). Anyone could make money, but not the “hamster” level. Perhaps there will be one last run of significant price pumping towards the end of 2024 -2025.
Candlestick chart of the wedge zone for comparison.
Local trend.
ALGO/USDT Local trend. Wedge breakout zone . 5 11 2023
The main trend. The entire trading history. Accumulation/distribution zones. Time frame 1 week.
ALGO/USDT Major trend. Cycles. 07 2023

ALGOUSDT 1D DOUBLE BOTTOMALGOUSDT 1D DOUBLE BOTTOM
ALGO has just built a DOUBLE BOTTOM. This is a good buy signal as long as it respects the SL.
It is clear where the ALTS are at. In a couple of months we will look back and think about the opportunities we had to buy really cheap.
SL 0.09
TP 0.23
TP1 0.33
TP2 0.45

Strong demand zoneALGO is in an uptrend and is currently approaching a strong demand zone. This area can act as significant support, potentially driving the price upwards. The price is moving slowly within this demand zone, which may indicate the market’s attempt to attract new buyers.
One possible scenario is that the price finds support in the demand zone and, after observing sufficient confirmations, moves upwards. This movement could indicate the continuation of the uptrend and the potential for further price growth.
Another scenario is that the price stabilizes after reaching the demand zone, and after observing strong confirmations, it moves upwards. This scenario suggests that demand is being absorbed in this area, leading to a new upward move.

Weekly Watchlist Analysis : ALGOWeekly Watchlist Analysis 📊
#Algo
#4h
In the first trigger of my strategy, the price has dropped by nearly 13% 📉. The previous uptrend exhibited clear signs of weakness:
Reduced Momentum: After each breakout, the price moved less each time ⬇️.
Increased Red Candles: More red candles appeared toward the end of the trend, indicating selling pressure 🟥.
Declining Buying Volume: The final wave saw reduced buying volume while selling volume spiked significantly 📈.
As the cycle high formed, the market entered a range after the drop, reinforcing the potential for an earlier short position 📉.
Entry Points:
First Entry:
After the Head and Shoulders pattern broke on the 1-hour timeframe, we got our first entry at the top of the move 🎯.
Second Entry:
As the price reached the next major support, we went for a correction. The green candles that followed lacked volume and size 📉. After the support was broken and a pullback occurred, the second entry was executed (another entry was made during the support break as well).
Third Entry:
Upon reaching the next key support level at 0.1258, a sell-off candle appeared, signaling the end of the trend or at least the start of a correction on the 4-hour timeframe 🕒. After ranging and forming a box, a false break to the downside occurred, which lacked the strength to break the previous high or even the box's high, indicating buyer weakness 📉. This was a signal to enter on the next break.
Currently, the ongoing downtrend lacks the strength seen in the previous trend. If selling volume doesn’t increase within the next 48 hours, there’s a possibility of a deep correction to the upside in higher timeframes 🔄.
Categories: Trend Analysis, Support and Resistance, Volume Analysis
Hashtags: #Algo #CryptoAnalysis #TradingStrategy #Tradecitypro #TCP 🚀
