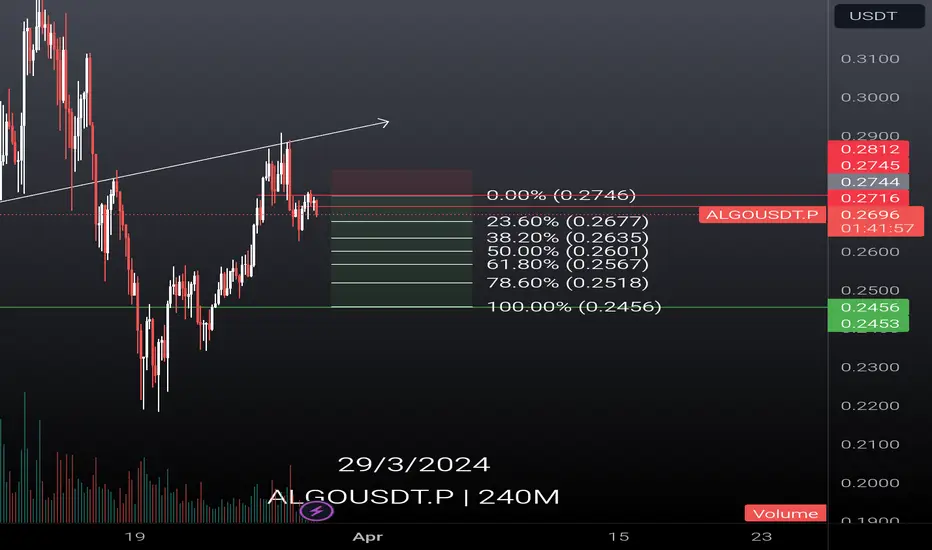
ALGO HEAD & SHOULDERThe price forms a head and shoulder pattern, signaling a good opportunity to take a short position. Once the price reaches my take profit level or I secure a partial profit, I will then enter a long position from that final take profit zone.
ALGOUSDT trade ideas

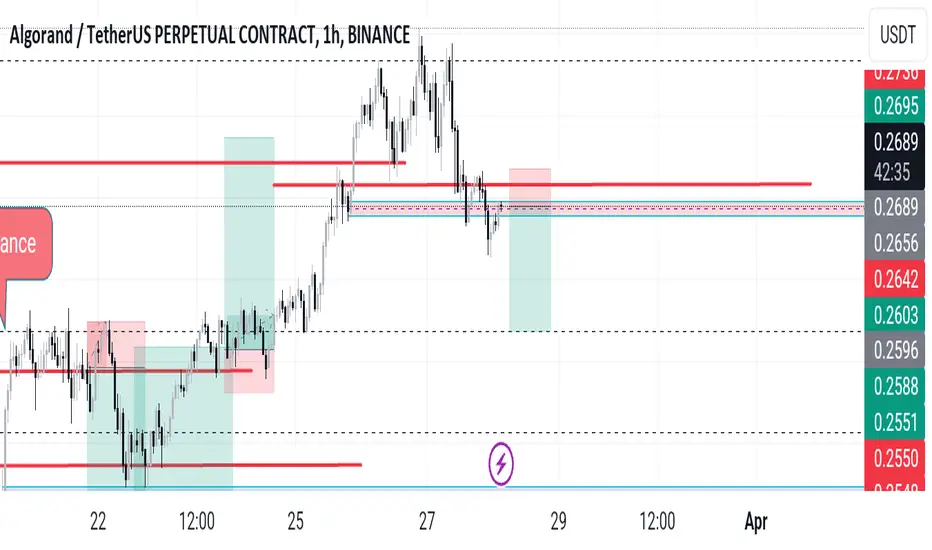
Support found and Confirmed!Im a little late on this juan but ALGO has confirmed support along with many other alts. With quite a few now breaking out of these consolidation phases, I am expecting the same here.

ALGO/USDT bullish reversal from support ? 👀🚀ALGO analysis💎 Paradisers, let’s delve into the intriguing movement of #ALGOUSDT. Currently, it’s retracing and meticulously retesting a critical support level at $0.2162. This level holds immense importance, and its ability to transition from a retest to a firm support could be a bullish signal.
💎 After successfully breaking out of a descending channel, the price of #ALGO is now confidently approaching the key support level at $0.2162. If the price sustains its momentum at this level, we can anticipate a bullish reversal. With sustained upward momentum, the target lies above the formidable resistance at $0.3277.
💎 However, should the price of EURONEXT:ALGO dip below this pivotal zone, it’s crucial to adapt our strategy. We foresee a bullish rebound from the secondary support level at $0.1939. Failing to regain ground here could potentially lead to further declines. Stay vigilant and agile as we navigate these market fluctuations!
MyCryptoParadise
iFeel the success🌴

ALGOUSDT-4H candle-Dow TheoryALGOUSDT Implementing Dow Theory 4 hours candle analysis
#dowtheory #algousdt #cryptoanalysis

ALGO: Pullback in UptrendTrade setup : Price remains in an Uptrend. We would be buyers on pullbacks near $0.25 support area, which is also near its up trendline, and could be an attractive swing entry in Uptrend, with +20% upside potential $0.30 near-term. Stop Loss (SL) level at $0.215.
Trend : Downtrend on Short-Term basis and Uptrend on Medium- and Long-Term basis.
Momentum is Bearish (MACD Line is below MACD Signal Line, and RSI is below 45).
Support and Resistance : Nearest Support Zone is $0.25, which it broke, then $0.20. The nearest Resistance Zone is $0.30, then $0.36 and $0.41.

ALGOUSDT - Cautious ApproachALGOUSDT is in downtrend but look like the bullhave started to gain strenght. A bullish divergence is formed when the prices were forming LL the RSI momentum indicator have shown series of HL. Current steup to go short is available at 0.38 fib retracement.

ALGORITHM IDEAThe price is being rejected at the 1-hour support level, which may result in a gradual price increase from this point.

ALGOUSDT: Bullish TrendALGOUSDT is bullish trend, price is showing action at 78.6 Fib retracement level and there is bullish diversion on RSI at HTF.

ALGOUSDTALGOUSDT is in strong bullish trend.
As the market is consistently printing new HHs and HLs.
currently the market is retracing a bit after last HH, which is 50% Fib retracement level and local support as well. if the market successfully sustain this buying confluence the next leg up could go for new HH.
What you guys think of this idea?

#ALGO this bull runThis is merely a prediction for ALGO during this bull run, and I will use Dollar-Cost Averaging (DCA) between the two red lines. The range is wide, but I am considering the big picture. This may take months to unfold, or it may not occur at all, as every altcoin tends to follow BTC.

ALGO: Pullback in UptrendTrade setup : Price remains in an Uptrend. We would be buyers on pullbacks near $0.25 support area, which is also near its up trendline, and could be an attractive swing entry in Uptrend, with +20% upside potential $0.30 near-term. Stop Loss (SL) level at $0.22.
Trend : Uptrend across all time horizons (Short- Medium- and Long-Term).
Momentum is Mixed as MACD Line is below MACD Signal Line (Bearish) but RSI ~ 50 (Neutral).
Support and Resistance : Nearest Support Zone is $0.25, then $0.20. The nearest Resistance Zone is $0.30, then $0.36 and $0.41.

ALGOUSDT SHORT OUTLOOKHello Traders, this is outlook that i think might be work. All Entry, Stop Loss, and Take Profit its already showed up. All trade it is on yourself. DYOR.

ALGO/USDT Long Term ProjectionLong term projection ALGO/USDT
The price action is starting to break above the Simplified Ichimoku Cloud, indicating a potential bullish reversal...
The RSI is showing an upward trend crossing above the 50 level, suggesting increasing bullish momentum.
Bullish target levels are marked based on Fibonacci retracement levels from the peak of the last Bullish wave to the bottom of the correction.
Happy Trading. T
Much more projections and breakdowns everyday,
Please follow and comment.

ALGO/USDT Bullish / Bearish targets. Possible playsRSI is below 40, indicating bearish momentum. However, it is not yet in the oversold territory, suggesting there could be more room for downward movement or consolidation before a potential reversal,
MACD line is below the signal line and below zero, which confirms the current bearish sentiment.
The On-Balance Volume is relatively flat with a slight downward trend, suggesting a lack of strong buying pressure.
Considering the current position below the Ichimoku Kinko Hyo, combined with the bearish signals from RSI and MACD, the immediate outlook appears bearish. However, as the price is approaching a significant Fibonacci extension level, be on the lookout for potential reversal signs. This could include bullish divergences on RSI, a MACD line crossover above the signal line, or a price breakout above the Cloud.

ALGOUSDT.PHello Trader BINANCE:ALGOUSDT.P
history chart algo has not been able to break through the new resistance area, pay attention to the green line, for the area is the nearest daily chart support, can be for scalping short for a period of 1-3 days this weekend.
take profit 10%
stop loss 2.5%
Please add a comment and Positive feedback and constructive criticism are important to authors and the community.
Disclamer: Not Financial Advice
ALGO BULLISHAlgo breaks the 4-hour resistance level, potentially leading to a significant price increase

ALGO HEAD && SHOULDER The algorithm is forming a head and shoulders pattern, indicating a bearish signal for a short position.
Mapping the ALGOUSDT On DailyGood day there,
Algorand has the potential to go up to form a lower high near the 0.2920 areas and drop to the low regions of 0.2223 and make a bullish pullback.
The potential uptrend can reach 0.3838 to 0.4231 highs.
The current daily bear candle, however, isn't clear. I used the Elliot Wave schematic for potential future resistance levels.
Happy Trading,
K.

130% GAIN OPPORTUNITY on Inverted H&S in weekly timeframeALGO
Algorand is a fast, secure, and decentralized blockchain network based on a pure proof-of-stake protocol. It’s known for its speed, scalability, and energy efficiency. Algorand is also carbon-negative and plans to introduce dynamic round times, incentivized consensus, a peer-to-peer gossip network, and native Python support in 2024. It’s a promising platform for decentralized applications.
Inverted H&S on weekly BINANCE:ALGOUSDT is forming.
Wait for a breakout on 0.28 level and in case of throwback, then go for a long with a
1st TP around 0.42- 0-44
2nd TP around 0.64 to gain 130%
stay tuned and do always your own research
----------------------
Not financial advise ;-) and Thanks for comments!

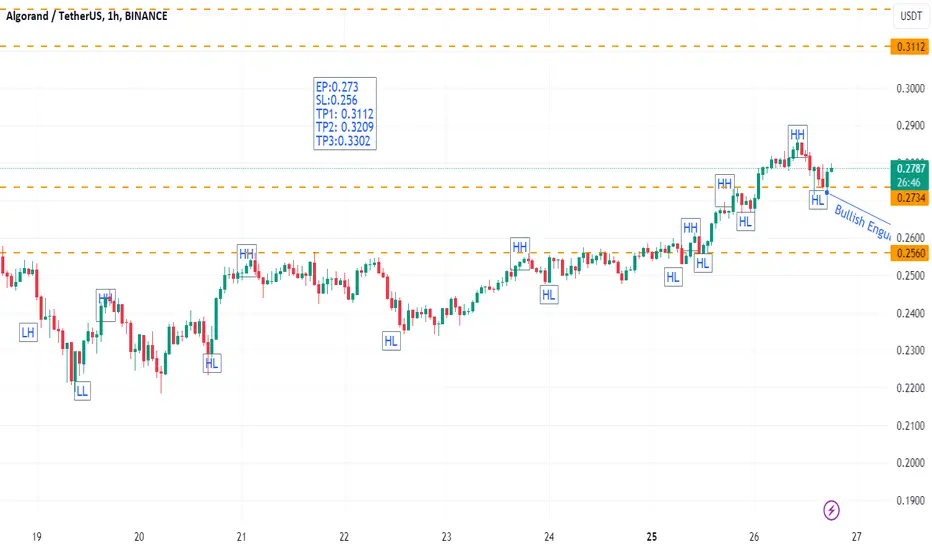
Algo - Quite Bullish Dow theoryAlgo is making HH - HL and volume is growing since last one week, quite bullish on this Pair
EP:0.273
SL:0.256
TP1: 0.3112
TP2: 0.3209
TP3:0.3302
ALGOUSD is printed bullish hammer closed on HL sideALGOUSD is printed bullish hammer close on HL in 1Hour time frame


Possible daily bullish divergence setUPPossible daily bullish divergence setUP
the most annoying part of the cycle IMO
