ALGO/USDT gearing up for potential upward?👀💎 Paradisers, gear up as #ALGOUSDT is currently displaying a promising setup, situated within a support zone, poised for a bullish climb.
💎 #Algorand is paying homage to the support level at $0.1837. There's a strong chance it might revisit the support at $0.1837. If the price can maintain its momentum at this level, we're looking at a bullish progression to breach a significant resistance level.
💎 Nonetheless, as savvy traders, we must be prepared for various scenarios. In the event our bullish anticipation does not come to fruition, a bullish resurgence from the support level at $0.1709 is within our contingency plans, with a descent below this threshold possibly signaling a substantial downward movement.
ALGOUSDT trade ideas

A Long Trade Analysis on ALGO/USDTThe $ALGOUSDTpair presents an intriguing long trade scenario. The daily chart unfurls a tapestry of technical patterns and indicators pointing towards an upward trajectory. The following insights serve as a navigational aid to dissect the elements that make this route a promising one for market participants seeking to ride the bullish tide.
Arguments for Embarking on a Long Trade:
Inverted Head and Shoulders Pattern: The chart displays a classic inverted head and shoulders pattern, with its completion potentially indicating a trend reversal from bearish to bullish.
Decisive Neckline Breakout: The price has confidently closed above the neckline of the pattern, suggesting a possible commencement of an uptrend.
Volume Confirmation: An increase in trading volume is observable during the formation of the right shoulder and breakout, which typically validates the pattern's reliability.
50 EMA Support: The price is trading above the 50-day Exponential Moving Average (EMA, pink curve), which may act as a dynamic support level.
Falling Wedge Breakout: Prior to the head and shoulders pattern, a falling wedge pattern (blue lines) was broken to the upside, reinforcing the bullish sentiment.
With a chart that reads like a bullish symphony, BINANCE:ALGOUSDT prepares traders for a potential voyage towards profitability. The technical indicators harmonize to suggest a promising long position with substantial upside. Navigators of this trade should set their compasses with caution, adhering to disciplined risk management strategies, such as setting stop losses below the recent low or the pattern's neckline. By recognizing the market's inherent unpredictability, traders can sail with confidence, prepared for both the calm and the storms ahead.
Trade Execution Plan:
Entry Point: A prudent entry might be on a retest of the neckline, ensuring that it holds as support.
Stop Loss: Position a stop loss below the inverted head and shoulders pattern to mitigate downside risk.
Take Profit: Calculate the profit target based on the depth of the head to the neckline, extrapolated above the breakout level, while being mindful of historical resistance zones. 200% TPR for my trade.
Good Luck

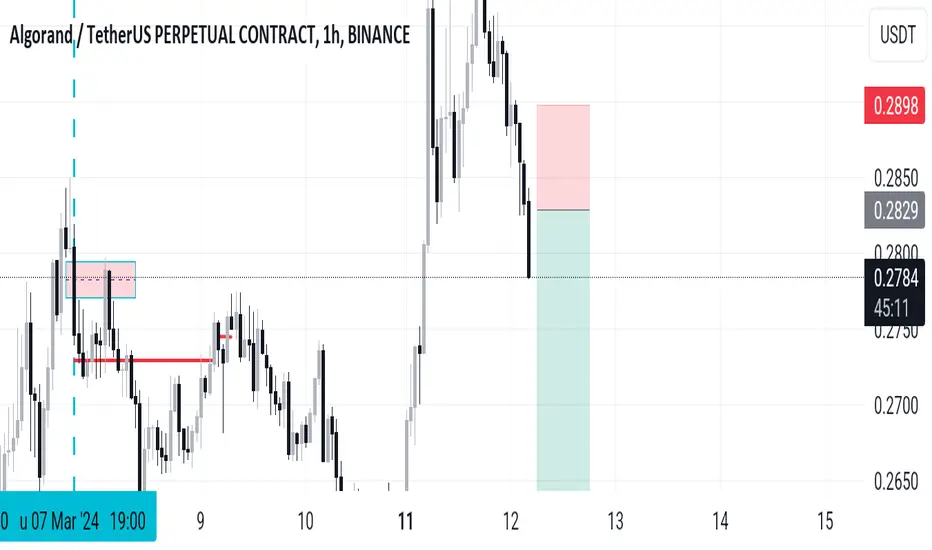
ALGO: Resistance BreakoutTrade setup : Following a bullish breakout from a Falling Wedge pattern, price resumed its Uptrend. Now it broke above $0.30 to signal continuation of that uptrend, with +20% upside potential to $0.36 near-term and +33% to $0.41 mid-term. Stop Loss (SL) level at $0.265.
Trend : Uptrend across all time horizons (Short- Medium- and Long-Term).
Momentum is Bullish (MACD Line is above MACD Signal Line and RSI is above 55).
Support and Resistance : Nearest Support Zone is $0.25 (previous resistance), then $0.20. The nearest Resistance Zone is $0.30, which it broke, then $0.36 and $0.41.

Algo|usdt EURONEXT:ALGO |USDT
As Shown In The Chart ,
It's Currently Trading Around Resistance Area ,
Once Broken It Will Jump Till
Short Term Target : $0.45 - $0.67
Mid Term Target : $1.77 - $2.26
Long Term Target : $3.5 - $5
Current Price : $0.3143

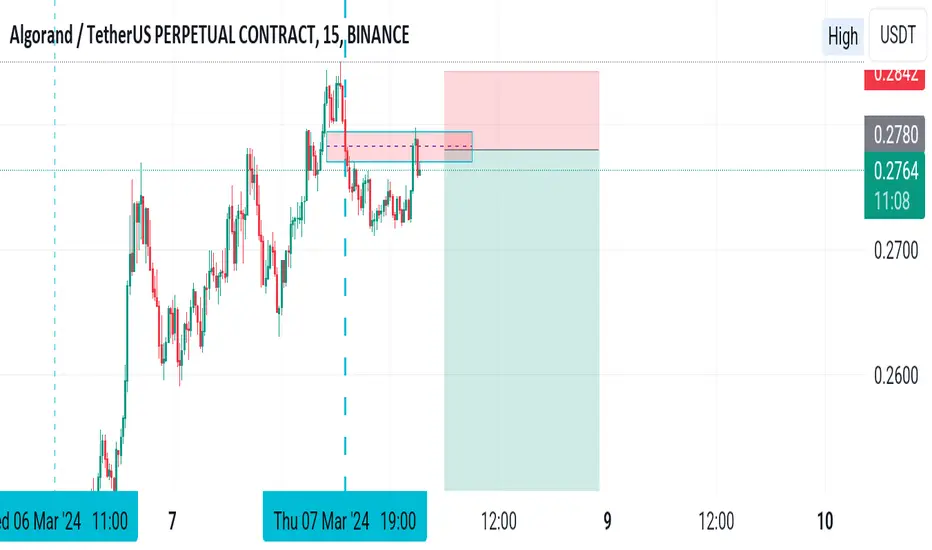
ALGO/USDT facing resistance in the supply area. Breakout ??💎 ALGO has recently encountered significant market dynamics. Currently, it is facing resistance in the supply area.
💎 If ALGO manages to successfully break out above this supply area, confirmed by a daily candle close, there is potential for continued upward movement, possibly reaching our target area.
💎 However, if ALGO fails to break out above the supply area, there is a risk of price rejection, leading to a gradual downward movement towards the support area to seek new momentum.
💎 The support area holds crucial significance for ALGO. The price needs to bounce from this level to attempt another breakout above the supply. Failure to sustain the support area, indicated by a breakdown, would be a bearish sign.
💎 In such a scenario, ALGO may switch back to a bearish trend, potentially leading to further downward movement towards the demand area or even lower levels.

The ALGOALGO/USDT is due for a retracement and correction after experiencing a significant uptrend previously.

ALGO Potential movementLike almost all other altcoins, ALGO is ready as a formation and it will do what it has to do soon.

Algo | a very good opportunityFrom technical view the chart looks super bearish, Yet I myself have great conviction that this is all preparation for huge heights.
A Long/Spot trade could be profitable.
Entry : 0.0988 - 0.0933
Stop : Daily close below 0.09188
The first three targets are short term and futures traders.
Last two are for holder.
Goodluck.

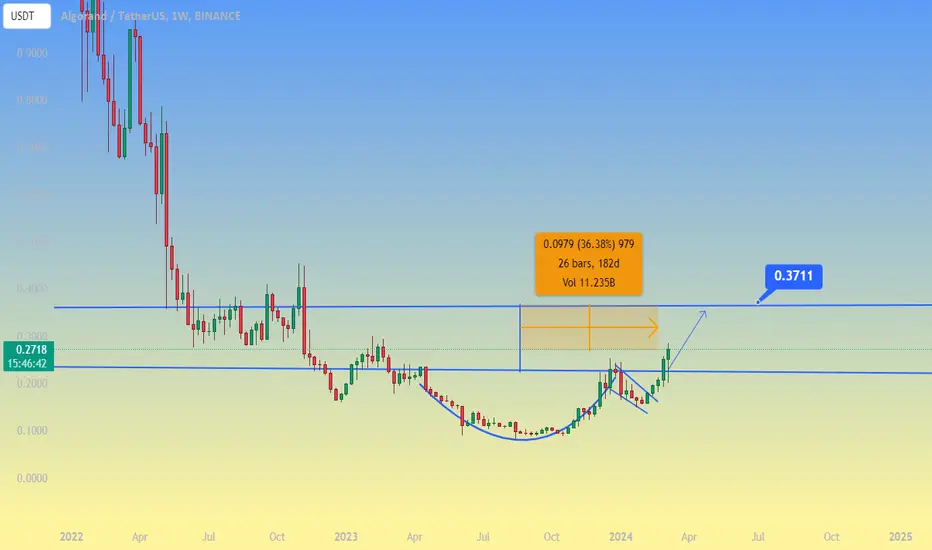
ALGO - CUP AND HANDELTake a look on the weekly chart for ALGO developing prefect cup and handle pattern and will break out with the next few days.
great entry point to get in before it shoots off !

ALGOUSDT | Potential +600% #ALGOUSDT
#DEGENPLAY
Great asset - breaking key structure now - looking to take off with a very achievable 600% potential and not pumped as much as the other mid caps. Buying @ $0.2930
🛑 For educational purposes only
🛑 These are not formally tracked or personally traded

ALGOUSDT Poised for Weekly Resistance Test: Can Bulls Breach theALGOUSDT is approaching a critical juncture, nearing a key resistance level of $0.2727 on the weekly chart. This analysis explores the potential for a breakout and the support levels to watch in case of a pullback.
Technical Analysis:
Resistance: $0.2727 (Weekly)
Support: $0.2199 (Daily), $0.1594 (Monthly)
Volume: Decent Buying Pressure
Moving Averages: 25 MA Acting as Support
Key Observations:
ALGOUSDT is facing a significant resistance level on the weekly chart. A breakout above this level could signal further upward momentum.
The recent price action indicates decent buying pressure, suggesting bulls are attempting to overcome this resistance.
The price has tested this weekly resistance twice on the daily chart, highlighting its importance.
The 25-day Moving Average (MA) is currently acting as support.
If the price fails to break above the weekly resistance, it could find support at $0.2199 on the daily chart and $0.1594 on the monthly chart.
A successful breakout could lead to further gains towards the next daily resistance level at $0.2376.
Conclusion:
The upcoming price action for ALGOUSDT hinges on its ability to overcome the key weekly resistance level. The presence of decent buying pressure and the supportive 25-day MA suggest a potential breakout. However, if the price encounters resistance, established support levels exist at $0.2199 (daily) and $0.1594 (monthly).
This information is for educational purposes only and should not be considered financial advice. Please conduct your own research before making any investment decisions.

ALGOUSDT1. ALGO formed a clear Cup and Handle on the weekly.
2. This move still has 34% to go up.
3. This also has confluence with previous support at 37 cents which may act as resistance.
4. We have strong weekly wick to the upside in most recent candle to help fuel this move.
ALGOUSDT | 1-2-3 Wave projection -Inverted Head & Shoulders +90%A possible 1-2-3 bullish pattern with an inverted h&s breakout
Target: 162% Fibonacci extension - wma200 week +90%
Entry: breakout retest wma20w
SL: week low position (week candle wick) -20%
RRR: 4:1

Ain't nobody got time for $Algo?Strong buy volume on the weekly candle above the 50 EMA + upper cloud.
Triggered a buy signal in my personal indicator.
Price is also at 2019 lows!
Cryptos could still drop before and after halving mercilessly, this will be the opportunity.
Open Long Position from 0.2500 with 10x leverage.

ALGOUSDT 3D#ALGO is the next 2~3X rally coin. Buy a bag and hold.
Inverse Head & Shoulder formation on #ALGO 3-day timeframe. Currently facing the neckline of iH&S and EMA200. Volume is good, so be ready for the pump. Targets are:
$0.3271
$0.4752
$0.5949
$0.7145

ALGO price update#ALGO Price Update: After a successful breakout from a zone marked in green, we will see massive gains. We could take entry after 4 hours candle close above the marked zone. Always use stop-loss. Everything is on the chart.

$algo about time this broke bad got a bag last nite just didnt post it since its been disappointing us for an eternity
going to take half off at 42c

Do you believe in the reverse head and shoulders pattern?The EURONEXT:ALGO has now clearly formed an inverted shoulder cypress pattern.
Do you see it too?
I see the break of the neckline, which is a buy signal for me, but on the other hand, it is still below the monthly resistance.
Considering the many surprises of Bitcoin and the fact that Bitcoin is forming a new ceiling and every time the new ceiling of Bitcoin is accompanied by the correction of the market, I could not decide to buy.
But it tempts me greatly.

ALGO🛩️For the past week, the algo/usdt has been hindering short traders from entering the market. Now, I believe it is time to anticipate a downward chop🪓.
202403 - ALGO Breakout > PumpALGO breakout resistance zone, time to fly now.
Expect target 20-30-50%

CUP With the successful crossing of the previous red line, we see a 200% growth..
Now the probability of forming a cup and handle pattern is very high....
We are waiting for a firm crossing of the red resistance of the edge of the cup.

ALGO update; BullishALGO broke the $0.2610 level and the next couple of target are highlighted on this chart! Please share your opinion too.
