Will Algo/Usdt do a correction?Hello,
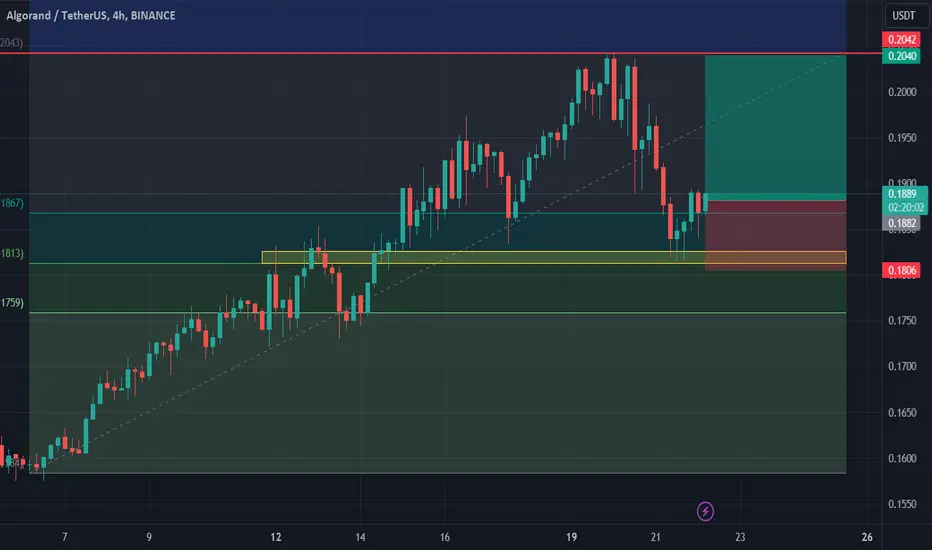
We see that Algo/Usdt has made appropriate movements according to the Fibonacci Retracement Levels in the channel it has been in since the beginning of the year. Even though I am on the bulls side in the macro view, it is possible that it will do a correction at least to 0.786 and maybe even 0.618 levels from here.
Short around $0.210 to
TP1: $0.1978
TP2: $0.1887
Cheers,
ALGOUSDT trade ideas

DECISIONSCrypto needs to build a setup for halving,
it was good YEAR for btc 2023....
ALGO needs a macro HIGHER LOW

ROLL OVERALGO is gon 2 take a dive ,
there surely is some news fabricated for justification reasons
but what are those
momentum down
price action bear
trend down

ALGO USDTEURONEXT:ALGO Update:
A favorable opportunity arises after confirming a breakout from the marked blue zone. It's advisable to use a stop loss for risk management. Always use stop loss. Everything is on the chart.

ALGOUSDT BUYMade a purchase at the spot. Goals on the chart. I will fix it in parts.
#algo #algousdt #algobuy

#algo-usdt#update previous analysis:
The previous wave is finished and diametric,
now,in X wave?
Close by crossing the threshold of 0.203, the pattern will be activated

ALGOUSDT QUICK TRADE - LONG - 15 MIN TFEmissary over here. Short time. Quick trade.
Yellow line entry limit order - 0.2011
Green line take profit - 0.1905
Red line stop loss - 0.2035
Setup will resolve in 2-3 days, maybe 5. No leverage needed.
DYOR, greettings
Leave your support, comment, boost, follow and thank you beforehand.

MMMarket maker had some friday fun,
Shakeout here and there, grab some liquidity xD
Human nature on both sides, best show ever.

ALGO/USDT Main trend. Cycles. 07 2023Logarithm. Time frame 1 week. Main trend.
Linear for clarity. .
Previous closed learning/work idea on this asset. Published 09 2022
ALGO/USD Major trend. Accumulation/distribution
Local trend and this reversal zone is shown in the main trend now.
Price recovery from the recent squeeze. Consolidation and formation of triangle formation. High probability of reversal. First local targets shown.

Destiny It is located in the middle line support of the ascending channel, as well as the four-hour static base support, from the perspective of the harmonic pattern of the butterfly the probability of growth is very high and will grow at the limit of 10%. It is excellent for oscillation

ALGO - Don't Sleep on THIS ALTCOIN 💎Hi Traders, Investors and Speculators of Charts📈📉
Welcome to 2024🥂🥳
And with the new year, we've been focusing on altcoins that have great fundamentals AND great upside potential.
Algorand is a decentralized network built to solve the Blockchain Trilemma of achieving speed, security, and decentralization simultaneously. Launched in June 2019 by computer scientist and MIT professor Silvio Micali, Algorand is a permission less, open-source blockchain network upon which anyone can build. Algorand is designed to be a payments-focused network with rapid transactions and a strong focus on achieving near-instant finality — that means processing over 1,000 transactions per second (TPS) and achieving transaction finality in less than five seconds.
Algorand uses a Proof-of-Stake (PoS) consensus mechanism, and distributes validator rewards to all holders of its native ALGO cryptocurrency. Through strong throughput capacity and equitable community incentivization, Algorand is capable of managing the high-throughput requirements of widespread global usage and a variety of use cases.
As a public smart contract blockchain that relies on staking, Algorand is currently capable of hosting decentralized application (dApp) development and providing scalability. Rising gas fees on Ethereum have led many dApp developers and decentralized finance (DeFi) traders to look for alternative blockchain solutions. Some have turned to Algorand as an Ethereum-alternative for dApp development and DeFi applications.
Algorand is still "in prison", but holding the 50d Moving Averages is the first step towards a new bullish cycle. Look at all of this upside potential:
If you found this content helpful, please remember to hit like and subscribe and never miss a moment in the markets.
_______________________
📢Follow us here on TradingView for daily updates📢
👍Hit like & Follow 👍
CryptoCheck

Algorand longAlgorand is bouncing off the support area which is also matching with the Fibonacci 0.5 retracement level. Bullish trend is expected to continue up to 0.204.
✴️ Algorand Early Reversal Signals (Name Your Altcoin)We are going to look up close because our goal is to see if there is reversal potential, as the correction has been going long enough and the market is turning all around us.
Algorand hit bottom in August.
We have a higher low in September and a higher low in October (yesterday).
Yesterday's session ended as a Doji which is a reversal signal.
This session also has above-average rising volume.
Summed up:
- Higher lows that lead to a reversal signal supported with rising volume.
These signals are early and weak but still valid.
From this point on a reversal can develop if the bulls follow up.
Additional confirmation comes when prices move above EMA10, EMA21, EMA50, etc.
When the RSI and MACD turn bullish.
When high volume shows up...
This might be a bottom catch.
Thanks a lot for your support.
Namaste.

Algo #chop #chopThe algo appears to be excluding long traders from the market. I am seeking to take a short position quickly from here.

ALGO Cup & Handle FormationMany alts still trading near the lows looking very bullish in preparation to breakout to the upside. Theyve been consolidating at the lows for very long time and ready to rock & roll.
Entry here is a bit high in terms of risk:reward with the stop loss at the last low ~$0.15.
I suspect a liquidity grad could take place first (retest the breakout) but that may not happen.
You can also look for entry after move up along the top of the c&h line where resistance will be looking to turn into support, thats where bulls will be setting up their next move higher to take out shorts.
Min target is $0.83 which is approx 4x from this 19c range. I would love to get a liquidity dip down to $0.10 before moving higher but that is unlikely to happen, possible but unlikely.
ALGO has taken a very long time with price action so I dont mind entering higher than cycle low ~8c. *c to 25c was a sweet 3x for those of you who bought n took profits, so now lets focus on the move higher to retest that $0.80 to $1 zone
The measured move (cup height) takes us to this zone. EW fib extension calculates to same zone, and we realign with the 0.236 fib retracement all surrounding a major support level that was broken on move down. If bull can reclaim that and turn it back into support, AGLO can continue much higher to complete the EW 5 wave sequence


ALGOUSDTI expect Algorand in the range of $0.4-0.6.Head and Shoulders is an effective reversal pattern.

AlgoUsdt is bullish and prices are looking to go upwardsHI everyone,
The old coins are finally shifting trends.
Algorand is one of them
The charts are looking positive
Inverse head and shoulders formation underway
12/26 Ema are bullish and pointing upwards
Price crossed 100 ema and will act as support
I am expecting .65 Cents to .70 cents target
On rsi indicator, the rsi line successfully retested previous trend line as support and momentum will take rsi to overbought level if momentum keep coming
Please like and subscribe as more charts are coming and more opportunities are presenting itself

algo inteligentassetBullish scenario
resistances 0.235,0.27 pivot high, 0.285,
0.32 in 800 ema
bearish scenario
supports 0.167 upper limit channel, 0.149 pivot low, 0.123, 0.0958

ALGO'S Cup & Handle pattern is nearing maturity!ALGO has been forming a nice cup & handle formation for quite some time now, as I've mentioned in my previous posts in the previous weeks. The handle is nearly complete, and I have a feeling that when the price breaks out above the rim-line... it's going to be EXPLOSIVE!
Good luck, and always use a stop!


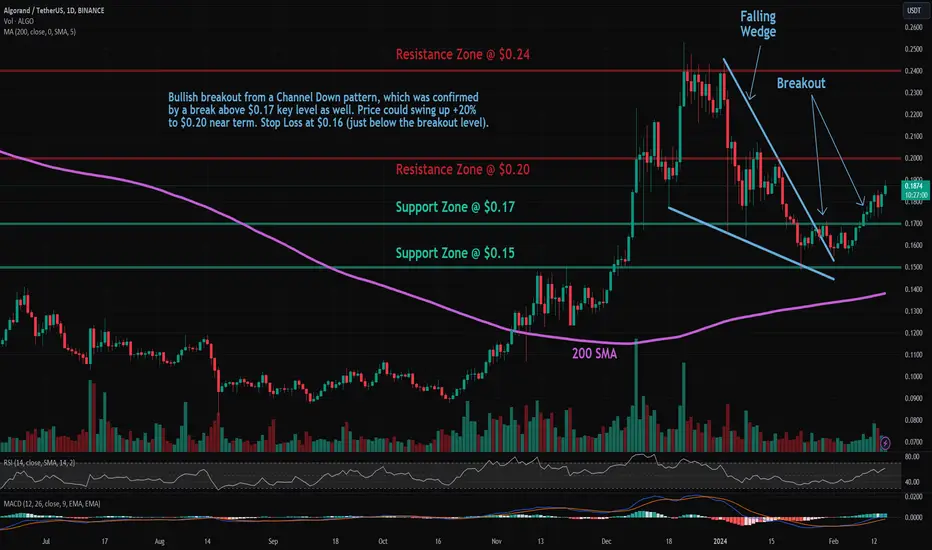
ALGO: Falling Wedge BreakoutTrade setup : Bullish breakout from a Channel Down pattern was confirmed by a break above $0.17 key level. Price could swing up +20% to $0.20 near term. Stop Loss at $0.15 (just below the next support).
Patterns : Falling Wedge Usually results in a bullish breakout. When price breaks the upper trend line the price is expected to trend higher. Most traders should wait for a completed pattern with a breakout and then place a BUY order.
Trend : Neutral on Medium-Term basis and Uptrend on Short- and Long-Term basis.
Momentum is Bullish (MACD Line is above MACD Signal Line and RSI is above 55).
Support and Resistance : Nearest Support Zone is $0.17 (previous resistance), then $0.15. The nearest Resistance Zone is $0.20, then $0.24.
WavesRolling rolling roling
Rawhide
Daily rsi iw on bull side but might turnout to be just a pullback
So more consolidation to get the weekly into the play?
