AlgousdtAlgo is in a bullish mode with 2days RTI crossover. Will it sustain the bullish with correction in due?
My view is there is a lot of fuel left in the tank to sustain. Weekly chart looks good enough for optimism.
ALGOUSDT trade ideas

ALGO: Overbought at ResistanceAlgorand (ALGO) technical analysis:
Trade setup : After getting rejected at $0.15 resistance a few times in November, price has finally broken above it to signal continuation of uptrend with upside potential to $0.24. However, price is now very overbought (RSI ~ 80!), hence, near-term, we’re likely to see it pause here on some profit taking.
Pullbacks to $0.18 area could be swing trade entry opportunities. Previously, price broke above above 200-day moving average, which confirmed a bullish trend reversal to an Uptrend.
Trend : Uptrend across all time horizons (Short- Medium- and Long-Term).
Momentum is Bullish but extremely overbought. (MACD Line is above MACD Signal Line). RSI is bullish (> 55) but extremely overbought (> 80) which could imply that price could briefly pause or pull back if it reaches Resistance.
Support and Resistance : Nearest Support Zone is $0.15 (previous resistance), then $0.11. The nearest Resistance Zone is $0.18, which it broke, then $0.24.

ALGOUSDT - Parabolic Exhaustion?Has had a good run up but could be getting fueled by greed and FOMO.
It will start entering into resistance levels where large orders are waiting (0.211).
There are other Proof-of-Stake cryptos that haven't yet experienced the POS news effect.
Be patient for confirmed break of support levels before entering Short as you don't want to fight against an irrationally bullish market

ALGO/USDT Break the key supply area. Bullish Momentum for ALGO ?💎 ALGO has been a standout in the market, recently achieving a notable breakthrough in a key supply area. It's now undergoing a retesting phase in the Lower Time Frame (LTF), setting the stage for potential upward movement. If successful post-retest, ALGO probability may move towards our targeted strong resistance area.
💎 However, if ALGO returns to the demand area, which previously acted as a supply zone, it will be crucial for it to demonstrate a strong bounce. This is necessary to mitigate the risk of a false breakout.
💎Failure to rebound and closure below the demand level could signal a false breakout, potentially reversing ALGO's trajectory. In such a scenario, ALGO might shift towards a downward trend, moving towards the next lower target, the support area.

ALGOUSDT - BEARISHPsychology:
if Price goes to: 0.1939 , it will bounce Back and made a new Lower High
Entry: 0.1939
Stop-loss: 0.1969
TP: According to your Risk

ALGOUSDTBINANCE:ALGOUSDT i think is ready for a huge move
⛔"Daily crypto market analyses I provide are personal opinions & not financial advice. Trading carries risks, so do your own research & seek advisor's help.#DYOR"
Don't forget to like and comment

ALGO Are You Ready for Expansion? Get past .14c it GAME ON!!Not financial advice.
Please also view my attached chart I posted before where I called the crash and said how important it was to hold .14c or we would likely try to come back to .06c
That came to pass didn't get to .06c but Uber close now time for reversal.
1st off I'd like to add that we need to get over
.14c and create support there before thinking about the .162 level.
But we have 3 areas of TP depending on overall market conditions.
Long term you can see the line I drew on the STOCH RSI that shows bearish divergence and I highlighted the top of that channel and where we can expect resistance/rejection.
Again .14c is key.
Stop loss is noted in chart along with Take profit ranges.
Remember to always practice patience.
#PIK
Patience Is Key
#TLAW
Think Like A Whale

Bitcoin Update | Alt Coin Update | ICP | FilecoinCHECK OUT THE LATEST Bitcoin Update | Alt Coin Update | ICP | Filecoin

ALGO/USDT Looking Good with Recent Bull Rally |👀 What's Next? 💎 Paradisers, shift your attention to ALGOUSDT, as it presents a notable trading setup in the demand zone, reinforced by a recent Market Structure Shift (MSS). This scenario suggests a substantial chance for a bullish trend.
💎 On analyzing ALGO's pattern, Algorand has a consistent record of breaking above its descending trendline, a harbinger of upward trends. It is currently targeting a key Bearish Order Block (OB) challenge, with continued momentum above the EMA100 indicating potential supply targets at $0.23 and $0.28.
💎 However, given the ever-changing nature of the crypto market, ALGO traders need to be equipped for different eventualities. Should the anticipated bullish surge not materialize, pivoting to a rebound strategy from the support level at $0.1325 will be crucial.
💎 A decline below this support level would call for a revision in strategy, highlighting the need to reassess the bullish stance and modify trading approaches to suit the evolving market context.
💎 Stay focused and tactically astute, Paradisers. Your ParadiseTeam is committed to providing you with comprehensive analysis and strategic guidance, helping you make informed decisions in these fluctuating market conditions.

Algorand (ALGO)On the above 5-day chart price action has corrected over 90% since the sell signal (not shown). Now is an excellent long trade. Why?
1) You know why.
2) Price action and RSI resistance breakouts.
3) Strong regular bullish divergence.
4) Price action prints on past support & resistance, look left.
Is it possible price action falls further? Sure.
Is it probable? No.
Ww
Type: trade
Risk: <=6% of portfolio
Timeframe: don’t know
Return: will say somewhere else

ALGO: Resistance BreakoutAlgorand (ALGO) technical analysis:
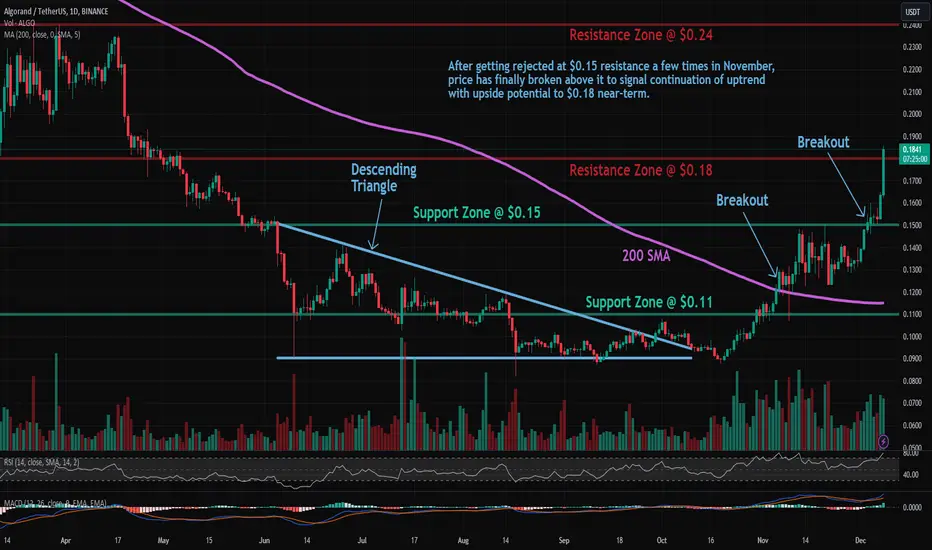
Trade setup : After getting rejected at $0.15 resistance a few times in November, price has finally broken above it to signal continuation of uptrend with upside potential to $0.18 near-term. Previously, price broke above above 200-day moving average, which confirmed a bullish trend reversal to an Uptrend.
Trend : Uptrend across all time horizons (Short- Medium- and Long-Term).
Momentum is Bullish ( MACD Line is above MACD Signal Line and RSI is above 55).
Support and Resistance : Nearest Support Zone is $0.15 (previous resistance), then $0.11. The nearest Resistance Zone is $0.18, then $0.24.
ALGOUSDT targets can be like the pictureALGOUSDT targets can be like the picture Buy with your own strategy, the analysis may be wrong


How do i expect to see $ALGO in 2025-2026 ? 8X possible?Hello fam,
I'm back with another perspective about Algorand with EURONEXT:ALGO symbol.
Comparing other altcoins, Algorand team works on real world solutions and recently partnered with UNDP to lunch Algorand Blockchain Academy.
But from candles world perspective we can clearly detect range formed and lows been swept away. This means we will have our eyes for range high to be tapped in coming weeks. This idea aims for 2.5$.
Besides there was a falling wedge that been broken recently. Falling wedges are reliable strong bullish patterns and most of times they deliver what we expect. as usual fib.0.5 to 0.618 is were we expect to see this wave end. This will be around 1.6$ . This is 8X from current price but as you already know there are many risks in Crypto market and you need to closely do your own research before taking any financial decision or trade.
Read my analysis about CRYPTOCAP:TOTAL , CRYPTOCAP:TOTAL2 and TOTAL3 for better understanding.
Further analysis required in case 1.6$ broken in weekly

IS ALGO READY?ALGO is attempting to breakout of the white dashed line which is resistance, this could be a straight send to the 200s

algousdtIf the price can cross the upper box, it can be expected that it will rise to the red area, but if it crosses the lower trend line, it will enter the range of 14 cents and then it will rise to the red area of 18 cents.
My personal opinion is that the upward movement starts here

ALGOUSDT (4H) - Bullish wave We2Hi Traders
ALGOUSDT (4H Timeframe)
A high probability, entry signal to go LONG will be given with the upward break of 0.1550 after the market found support at 0.1459. Only the downward break of 0.1459 would cancel the bullish scenario.
Trade details
Entry: 0.1550
Stop loss: 0.1459
Take profit 1: 0.1687
Take profit 2: 0.1828
Score: 8
Strategy: Bullish wave We2

$ALGO -keep the faithHola,
approaching a key level to flip before we accelerate
has been dormant for a while but apparently been doing a lot of work behind the scene and building.
emotionally hard for the hardcore algo fans to hodl on but now is the time to sit back and enjoy the ride just rambling on here since been told off to provide a detailed explanation of the trade by TV
large caps usually leg up first then mid and low so looking for this as my large cap candiate also btc dominance is set to have a decent pullback imo
remember to keep your targets realistic and hop off as you are happy do not be a dick for a tick and miss out 90% just to get the extra 10%
rotating capital into trades as i get a decent move on my current play
expecting a loco flush to wipe out OI which will increase like loco on this move up
so be extra carefull not to give back the money you have made last few months
for some reason i have the 12th day of christmas earmarked as be carefull and risk off no particular reason just recon our pullback should happen then .
will put a link in later for ltf for invalidation but trigger for a long for now is a flip of the white line .
hope everyone is having a lovely day .. carpe d!!

Up to 100% with ALGO In the near future, more than 500% profit is waiting for Algorand holders, be careful

Algo - It's time to relax! ✅✅✅I think we have completed 1 wave of growth, which was an impulse. The previous idea worked great and brought us more than 40% of the movement with a stop of less than 5%. Let's continue this trend)))

Potential Price ReversalALGO has demonstrated a notable uptrend, successfully overcoming a resistance level that previously hindered its price growth for several days.
This bullish momentum led it to encounter another resistance zone. At present, the price growth has stalled, suggesting a potential reversal to the downside. However, a newly formed support zone has emerged, which could act as a buffer against further decline in price.
This support level, potentially a key pivot point, is positioned around $0.1357 to $0.1370. If it holds, it might catalyze a renewed upward movement in ALGO's price.
This analysis is for informational purposes only and should not be considered as financial advice.

ALGO: Resistance BreakoutAlgorand (ALGO) technical analysis:
Trade setup : After getting rejected at $0.15 resistance a few times in November, price has finally broken above it to signal continuation of uptrend with upside potential to $0.18 near-term. Previously, price broke above above 200-day moving average, which confirmed a bullish trend reversal to an Uptrend.
Trend : Uptrend across all time horizons (Short- Medium- and Long-Term).
Momentum is Bullish (MACD Line is above MACD Signal Line and RSI is above 55).
Support and Resistance : Nearest Support Zone is $0.11 (previous resistance), then $0.09. The nearest Resistance Zone is $0.15, which it broke, then $0.18.

LONG on ALGO Price surpassed the previous high of 0.1504 and continued above, breaking the marked 4HR order block. A valid retest of the OB would signify an opportunity for a relatively strong long position, in my opinion.
There is an unmitigated FVG (0.156) from May of this year that could serve as resistance for a bounce. If price nears the FVG and pulls back for the retest, the OB (0.1530-ish) will be the point of entry.
(Note that price could just as easily reverse and retest before reaching the FVG)
My trade:
SL - Placed comfortably below the OB
Target - Balanced Price Range around the ballpark of 0.1750
