ALGO's BEAR TRAP: Pump in the Process?Algorand (ALGO) has orchestrated a fascinating move that has caught the attention of traders and investors alike. It appears to have fallen below a key support level, but could this be a cleverly designed bear trap? Many speculate that a pump might be on the horizon. Let's dive into this intriguing market development. 📈💥
The Fall Below Support:
ALGO recently breached a key support level, causing some concern among traders. However, in the world of crypto, not everything is as it seems.
A Potential Bear Trap:
While the drop may look ominous, it has all the hallmarks of a bear trap. This deceptive move is designed to lure in short-sellers who anticipate further decline, only to spring a surprise pump.
The Pump in Waiting:
ALGO's setup suggests that a pump might be in the making. The bear trap could be the trigger for a swift and substantial price surge.
Trading Strategy:
Vigilance: Keep a close eye on ALGO's price action, especially in the wake of the support breach.
Risk Management: Maintain sound risk management practices to protect your investments in the volatile crypto market.
Stay Informed: Stay updated with the latest news and developments related to ALGO that could influence its price movements.
Conclusion:
The crypto market is filled with clever maneuvers, and ALGO's recent move could be one of them. A bear trap, if that's what it is, often leads to a rapid and powerful reversal.
As you navigate these market intricacies, remember that vigilance is key. Be prepared for unexpected turns, and may your trades lead to success.
❗️Get my 3 crypto trading indicators for FREE❗️
Link below🔑
ALGOUSDT trade ideas


Algorand Price Surges Above Exponential Moving Average 200!
Algorand (ALGO) has soared above its Exponential Moving Average 200 (EMA200), hinting at a remarkably bullish run!
For those of you who relish the excitement of trading in fast-paced markets, this exhilarating development presents an unmissable chance to capitalize on the strong upward momentum of ALGO. The fact that it has surged beyond its EMA200 signifies a significant shift in its overall trend, indicating the potential for substantial gains in the near future.
Now, you might be wondering, "Why should I long Algorand?" Well, the reasons to do so are plentiful. The recent breakthrough above EMA200 showcases the cryptocurrency's resilience and solidifies its position as a growing force in the market. Furthermore, Algorand's cutting-edge blockchain technology, combined with its ability to handle high transaction volumes with minimal fees and superb scalability, has garnered widespread attention and acclaim within the crypto community. It is worth noting that Algorand's dedicated team of visionaries and prominent partnerships add further credibility and potential to this digital asset.
So, fellow traders, let's seize this exhilarating opportunity and consider initiating a long position on Algorand (ALGO) today. With the price soaring above its EMA200, it's an exciting moment to ride the upward wave and potentially secure significant profits. Don't miss out on the action!
As we navigate the fast-paced world of cryptocurrency trading, remember to stay informed, set stop-loss orders for risk management, and always trade responsibly. May each trade bring you adventure and success!
To embark on this exciting journey with Algorand, act now and place your long position. Get ready to ride the waves of profit!
Call-to-Action: Take advantage of Algorand's surge above its EMA200 and seize the opportunity to long ALGO today! Place your trade and enter the thrilling world of potential profit now. Don't delay, act today!

Public idea on LONG Position ALGO/USDTThis instrument was in a bearish phase for 721 days. Now we see how it begins to gradually accumulate and looks very attractive for the following year. I think it is possible to make a bet within a reasonable limit of 5% of the capital

ALGOUSDT WAlgo is on uptrend and my position is in weekly time frame until 0.55$ with 0.088$ sl snd 11.5 risk to reward

$ALGO Mark up phase beginsALGO is trying to reclaim the c19 lows here. This is typically the first sign of the reversal, sweeping the lows, and then rejecting the continuation lower.
From here you would expect to retest .23 cents illustrated by the golden bubble, which also shows a correlation between this level and .41 cents, with some chop inbetween.
The next range we would want to pay attention to is the first purple range. Historically, if support is found here, we would expect a continuation to bring us to the purple range above it at around .66 cents, which is also the .618 retrace, and a local 1.618 ext.
Above that, an extension a degree up would bring you to 1.27, and the purple zone at about 1.58.
Following the levels on these reversals is important, and even more important is paying attention to the way price moves between them, and ignoring the static. The spaces in between are used to chop you up and wont neccessarily be so clear cut.
Im not forecasting expectations, just the path in which a reversal is most likely to unfold and mathematically based extensions / retracements of the data we do have.
This idea is supported by all momentum oscillators including ADX, BBWP, RSI and Money flow. All of which, suggest that we are in the very early stages of a major impulsive move upward.

Algorand - Big falling wedge is breaking outAlgorand is ready for a big move to the upside.
Falling wedge breaking out
First target 0.16 and after top of the wedge towards 2 dollar.
Looking promising!

ALGO target 0.1754h time frame
-
ALGO is creating a potential bottom structure. There are two ways to estimate targets, first one is Fibonacci Projection, this target is 0.125. Next one is obvious structural supply zone from 0.17~0.18. Both ways are good to set up trading plan. If ALGO trigger a surging trend, then we can see 0.17 in near future, but shall notice PA while close to 0.125
TP: 0.175
SL: 0.094

ALGOUSD bull thesisafter almost two years of downtrend, for the first time the trendline has been breached. This is one of my favorite bull setups, because its easy to spot and only requires a lot of patience.
no one knows how high this can get. but i assume a 5-19x is possible depending how crazy crypto will get pre halving. also not sure if this already qualifies as a dinosaur coin so there might be less interest by newcomers in the market to trade this coin.
for the record, i'm just papertrading this. buy at your own risk.

ALGO - underrated coin with momentum on its sideALGO is breaking out of historic trendline now and closed above Tenkan 3D.
I'll trust the momentum is here when it's closing within the cloud and above TP1.
That will trigger a massive bullrun for it.

ALGO BULLS TO TAKE OVERHello Traders and everyone, I am Hadi Karaali, Known as SNIPERS_FX
If you like the idea, do not forget to support with a like and follow.
What's next on ALGO.
As we can see price is still sitting around our all-time low adding on around a strong round number, where we will be looking for new longs as well.
Meanwhile, for the bulls to take over from a medium-term perspective, we need a break above the marked major swing high, then a movement higher would be expected as a shift in momentum from bearish to bullish.
Until that price is still overall bearish and price can still trade lower and lower.
If you like this kind of analysis don't forget to like and follow
and as usual follow your trading plan and manage your risk.
Be patient and good luck!

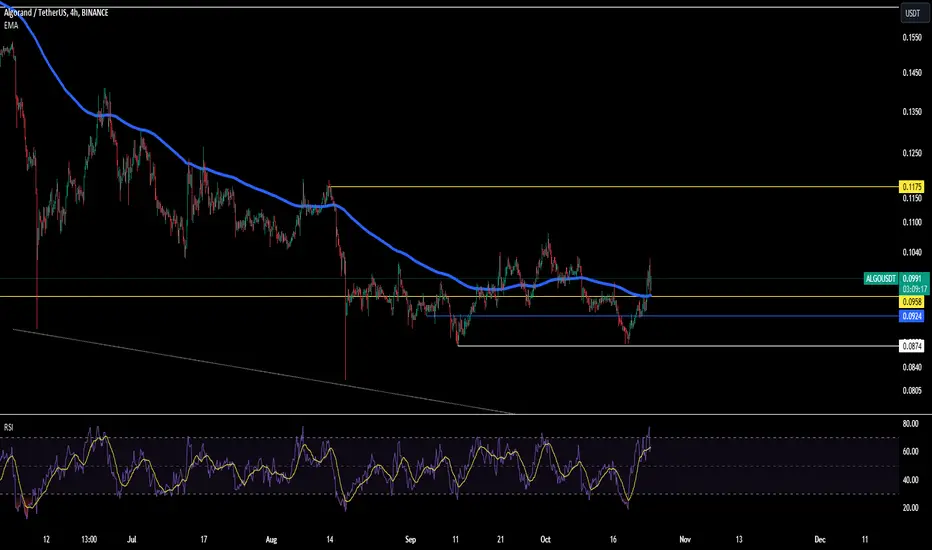
ALGO/USDT Ready to continue upward Movement ?? Bullish Momentum💎 ALGO has undoubtedly seized our fascination, successfully breaking through the descending channel pattern. Following this breakout and a subsequent retesting phase, ALGO embarked on a significant upward journey, only to face a stern rejection at the resistance zone.
💎 Currently, ALGO is retracing to the nearby support level at $0.097, seeking fresh momentum for another breakout attempt. A crucial bounce at this juncture is necessary for ALGO to rally back and challenge the resistance zone once more. Should ALGO manage to break this resistance and secure a position above, Probability would pave a smooth path toward its next targets - the supply zone and the bearish OB.
💎 However, ALGO's trajectory could take a negative turn if it fails to maintain its stance above the support or within the demand zone. Should ALGO falter in upholding the support level, it still reserves a lifeline at the demand zone. It's imperative at this demand level for ALGO to manifest a bounce; failure to do so could signify a forfeiture of the demand zone, potentially triggering a retreat to the robust support zone below.
💎A precarious scenario unfolds if, upon retesting, ALGO shows no signs of bullish rejection or bounce within the demand zone. This weakness could be a harbinger of ALGO's potential loss of the demand zone. If this materializes, the bullish momentum may wane, giving way to bearish tendencies and priming ALGO for a downward spiral, seeking solace back at the strong support zone.

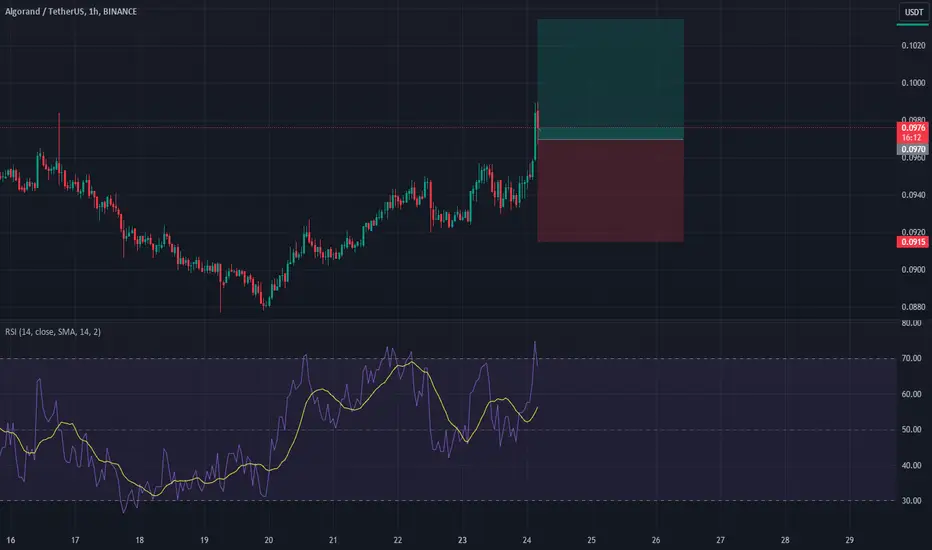
ALGOUSDT - Bullish I'm considering a long position in ALGOUSDT at a price of $0.0970. My analysis suggests that ALGO is currently following a bullish trend, in alignment with the principles of Dow Theory, and consistently forming higher highs and higher lows, which are indicative of a robust bullish pattern.
In addition, I've identified a bullish divergence on the 1-hour timeframe, further supporting the case for a potential bullish move.
For risk management, I plan to place a stop loss at $0.0915, just below the last lower low. This approach is designed to mitigate potential losses. As for my target, I'm aiming for a 1:1 risk-reward ratio, with the initial target set at $0.1025.
It's important to keep in mind that while this analysis suggests a favorable setup, the cryptocurrency market can be highly volatile. Therefore, conducting thorough research and staying updated on market developments is essential before making any investment decisions
ALGO trade working out well so far!First target hit, in hindsight I should have added more but oh well! That is trading.
Lots of strength here.

A ALGO currency tight analysisHas a good volume in terms of marketing
Preserved and fulfilled the hopes and could hope
I expect to come to resistance levels
0.1184 - 0.12 - 0.14 - 0.15 - 0.1744
It is currently in Ardar Block area and has grown well
If the BTC can grow the same or remain in an area of suffering, the Sisen will occur and the Algo currency can grow well.

🚨 Trade Alert: ALGO/USDT (3-5x)🚨 New Trade Alert 🚨
✅ ALGO/USDT (3-5x)
📉 LONG Entry Zone: 0.102 - 0.1092
⛔️ SL: 0.0986
🔒 Breakeven Move: When it moves close to TP2
🎯 Take Profit:
Short Term: 0.1103 - 0.1120 - 0.1140 - 0.1180 - 0.12
Mid Term: 0.13 - 0.14 - 0.15 - 0.16 - 0.17
📝 Ensure you set entry orders to balance the trade's entry and aim to secure 30% of profits within the first two targets. Once profits are gained, adjust the stop orders to match the entry points or break-even levels.
⚠️ Disclaimer: Historical earnings cannot assure future outcomes. Is there a potential for risk? Certainly. The entire financial market is susceptible to uncertainties; any underlying factor or abrupt shift in market sentiment could overturn the current market trends and lead to losses. Refrain from undertaking undue risks that might jeopardize your financial stability. You are under no obligation to engage in this trade; kindly avoid the trade if you disagree with the trade analysis.
GIS TRADING®

ALGO...going long here with targets to take profits.Love this chart. Notice how the volume patterns are green dominant, this is what we want.

ALGO 1W bullish breakout impending ALGO on weekly printing massive falling wedge. Resistance at 0.10595 level needs to break for huge run up.

RR=4.4 Buy idea bullish RSI divergence + bullish butterfly pattern + breakout of resistance level ; possible reversal scenario PS never risk more than 2% of your capital per trade

$ALGO- worth the wait..or notabove 200 ema on H4 and support turned resistance
as long as we stay above
range high next
good r/r if anyone fancies
Long trade setup for ALGOUSDTFor the BINANCE:ALGOUSDT.P Long Trade Setup, the following values are suitable for our interval trade:
Entry: 0.0919
Target: 0.0959
Stop: 0.0847
Cost Reduction: -
The profit is reasonable relative to the risk.

ALGO SETTING UP TO PUMP?!?!Algo looks bullish. Looking at the chart we can see a few ways how the algo price action might play out. If this breaks out to he upside, I mapped out where I think price will go and where to exit or take profit. (Golden Pocket (Orange Line))
Calculate Your Risk/Reward so you don't lose more than 1% of your account per trade.
Every day the charts provide new information. You have to adjust or get REKT.
Love it or hate it, hit that thumbs up and share your thoughts below!
This is not financial advice. This is for educational purposes only.

Algo ready for trend change(bullish)Okay,I know we all been watching the steady downtrend of EURONEXT:ALGO for a very long time but hear me out, I think its finally time it starts to pop off. Monthly has reached a strong support zone. Multiple candles rejecting. Higher time frames showing clear rejections where price has finally made the same low. Double bottom formation. For ideal traders, I will wait for a break out and retest. I'm personally adding positions here with a long sl. Will keep you all updated. Best wishes to everyone!
