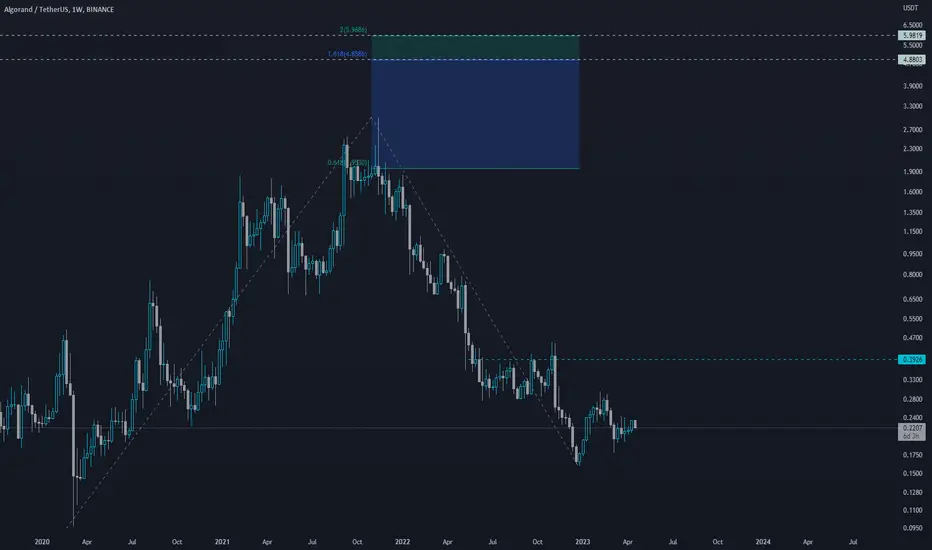
ALGOUSDT great RRAlgo stands at the double Fibonacci support, which implies a potential short-term rally throughout this week. A new lower low will immediately invalidate bullish outlook, but for now things are looking bright for ALGO.
ALGOUSDT trade ideas

ALGO ready to go down! (Short)After a minor pullback to change of character area, I expect a liquidity grab from the prior high and go down from there.
NFA

Algorand BullsWonder how this plays out for the SEC, if they have a call record like cramer than this should moon!

Algo/USDT on 4 HR TF4 HR long position, with SL and TP, RSI oversold, Vol comming in weit to breake the suport line. lose smole win big

LONGBUY LIMIT ( Not Now )
EP1: 0.22408
EP2: 0.21880
The stop loss if the 2 entry orders are activated, will be about 5%.
Instead of gambling and entering now The price may return to the entry points shown on the chart
enjoy

ALGO Short Plan with a few supporting TAOKX:ALGOUSDT
Completeness of Harmonic Pattern with a traditional chart pattern signal.
Break-retest level will be a short plan.
Diagonel support zone which comes from the lowest level of the chart can be a target is also 618 level of the harmonic pattern.
May the force be with you.

ALGOUSDT needs to create a new breakout!BINANCE:ALGOUSDT is currently testing the weekly resistance level at the 0.23 USD area, which is an important level to watch as it has acted as resistance in the past. A breakout above this level could signal a bullish trend continuation, as it would indicate that buyers are willing to push the price higher despite the resistance. Traders may want to wait for a breakout above this level and a retest of this area as new support before considering a long position.
According to Plancton's rules, if there is a breakout above the 0.23 USD area, it would suggest a new long position as it indicates a potential trend reversal to the upside. This rule suggests that traders may want to consider entering a long position in anticipation of a potential price increase.
Overall, the market sentiment for ALGOUSDT appears to be bullish, with the potential for a breakout above the weekly resistance level at the 0.23 USD area.
–––––
Follow the Shrimp 🦐
Keep in mind.
🟣 Purple structure -> Monthly structure.
🔴 Red structure -> Weekly structure.
🔵 Blue structure -> Daily structure.
🟡 Yellow structure -> 4h structure.
⚫️ Black structure -> <= 1h structure.
Follow the Shrimp 🦐


ALGO/USDT - Algorand: Resistance_Breakout_Confirmation◳◱ A Resistance Breakout and Confirmation has been detected on the SIX:ALGO / CRYPTOCAP:USDT chart. The price has broken above a key resistance level and has been confirmed by a strong candle, indicating a potential bullish trend. The next resistance key levels are located at 0.2247 | 0.2329 | 0.2501, and the major support zones can be found at 0.2075 | 0.1985 | 0.1813. Consider entering a trade at the current price zone of 0.2313 and targeting higher levels.
◰◲ General info :
▣ Name: Algorand
▣ Rank: 40
▣ Exchanges: Binance, Kucoin, Bybit, Huobipro, Gateio, Mexc
▣ Category/Sector: Infrastructure - Smart Contract Platforms
▣ Overview: Algorand is a scalable, secure, and decentralized digital currency and smart contract platform. Its protocol uses a variation of Proof-of-Stake (PoS) called Pure PoS (PPoS) to secure the network and reach consensus on block production. Unlike other PoS models, PPoS does not reward, nor does it put validator or user funds at risk of being slashed (a loss of funds used to promote honest node and user behavior). Algorand intends to eventually leverage its PPoS design to form the foundation for an on-chain governance system.
◰◲ Technical Metrics :
▣ Mrkt Price: 0.2313 ₮
▣ 24HVol: 12,134,262.215 ₮
▣ 24H Chng: 5.858%
▣ 7-Days Chng: 4.60%
▣ 1-Month Chng: 11.99%
▣ 3-Months Chng: 0.01%
◲◰ Pivot Points - Levels :
◥ Resistance: 0.2247 | 0.2329 | 0.2501
◢ Support: 0.2075 | 0.1985 | 0.1813
◱◳ Indicators recommendation :
▣ Oscillators: BUY
▣ Moving Averages: STRONG_BUY
◰◲ Technical Indicators Summary : STRONG_BUY
◲◰ Sharpe Ratios :
▣ Last 30D: 0.76
▣ Last 90D: 0.54
▣ Last 1-Y: -0.78
▣ Last 3-Y: 0.63
◲◰ Volatility :
▣ Last 30D: 0.90
▣ Last 90D: 0.86
▣ Last 1-Y: 0.95
▣ Last 3-Y: 1.20
◳◰ Market Sentiment Index :
▣ News sentiment score is N/A
▣ Twitter sentiment score is 0.60 - Bullish
▣ Reddit sentiment score is 0.46 - Bearish
▣ In-depth ALGOUSDT technical analysis on Tradingview TA page
▣ What do you think of this analysis? Share your insights and let's discuss in the comments below. Your like, follow and support would be greatly appreciated!
◲ Disclaimer
Please note that the information and publications provided are for informational purposes only and should not be construed as financial, investment, trading, or any other type of advice or recommendation. We encourage you to conduct your own research and consult with a qualified professional before making any financial decisions. The use of the information provided is solely at your own risk.
▣ Welcome to the home of charting big: TradingView
Benefit from a ton of financial analysis features, instruments and data. Have a look around, and if you do choose to go with an upgraded plan, you'll get up to $30.
Discover it here - affiliate link -

#ALgoGood PLace which is Cluster with Dynamid UP Trend and Static Support
PDC = Previous Close Day
Scalpe target = 1% without Lev

Short term target 0.2824Following weekly chart. Getting a long signal from my 2 indicators.
TP 0.2824 ( around 30%)
SL 0.2 - Please wait for weekly candle close to stop.

ALGO Sell Limit 😎✅😎✅😎Hi dear traders
ALGO moving in flat channel.
The price is retesting the 0.2244 resistance and making a false breakout.
We can see bearish divergence between price and volume.
I expect the price to return to the specified area.
We are trying to take 📈 in short term
Wait for confirmation
All targets specified
Let's see what happens
This is not financial advice (DYOR )
Good luck

ALGOUSDT - 1h Bullish TrendAn advancing trend is observed along with two bullish candles, a hammer along with tweezers bottom. The bullish trend may continue.

ALGOUSD-Support and ResistanceALGO is moving in between support and resistances. We have placed both, Buy Stop and Sell Stop orders to play accordingly.

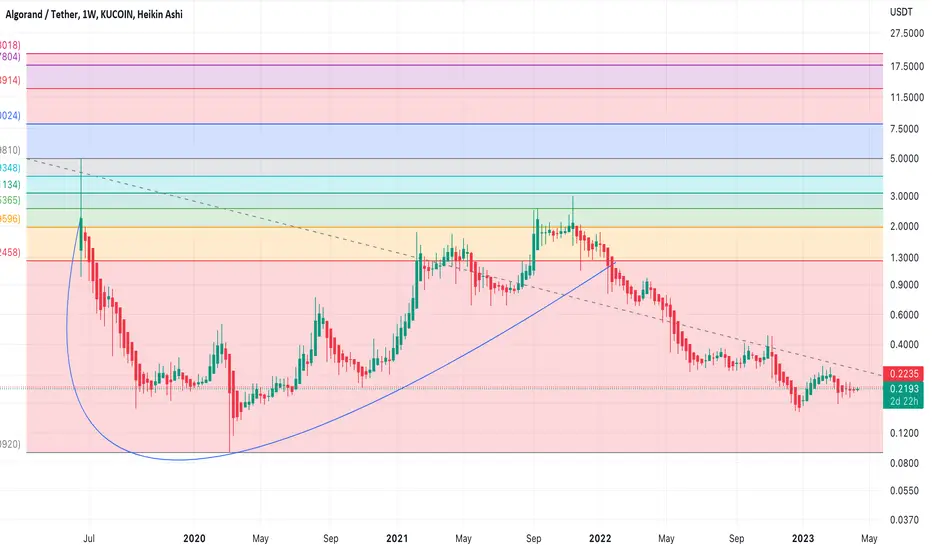
ALGO - Road to 2024HTF - We are about to print LL and imo 2023 will start with a Bear Market Rally.
LTF - I dont know, I dont care, I am not good at it. I only SPOT TRADE.
This is my 2nd bear cycle and about to be my 3rd bull cycle,
and if history at least rhymes with the past, then it’s time to accumulate.

Algorand just broke above a Flag Pattern and heading up to 0.226Falling Flag formed on Algorand after the price previously went on a strong uptrend.
We now have the price breaking up and out of the flag.
Target 0.2261
Price >200 RSI =50
SMC
Below the flag, we can see there is Sell Side Liquidity Order Block which is coming in with strong orders from Smart Money.
This is where SM is sweeping selling orders and buying into them, which is pushing the price up.
FACTS ABOUT Alogorand
Algorand is a blockchain-based platform for developing decentralized applications (dApps).
It was founded in 2017 by Silvio Micali, a computer science professor at MIT and a Turing Award recipient.
It's designed to be a high-performing and secure blockchain platform that can process thousands of transactions per second.
They use Pure Proof of Stake (PPoS), which allows for fast and secure transaction processing.
Algorand has its own native cryptocurrency called ALGO, which is used to pay for transaction fees and to participate in the network's governance.
Algorand has been used in a variety of applications, including real estate, gaming, and supply chain management.

Short the ALGOHello Traders!
Welcome back to another trade with analyst Aadil1000x.
Today we are selling Algo because of a strong reversal pattern.
Algo SHort Now @ 0.2223
Stoploss 0.2275(-2.3%)
Target 1, 0.2157(+2.9%)
Final Target 0.2107(+5.17%)
Don't forget to hit the like button and follow to stay connected

Trade Alert(s) - Take ProfitTraders,
Unfortunately, I am too uncertain about how altcoins will respond when Bitcoin pulls back to tolerate this level of risk on the table. So, I have chosen to take profits on two coins coming up into resistance here: ALGO and DOGE. I will re-evaluate a decent re-entry area once I know this resistance is or will be defeated.
Stew

ALGO - Consolidating, be patientThe gray resistance from my previous post has already been tested twice, and is holding tight.
Nevertheless, bearish reaction hasn't been strong either.
Right now, we are just consolidating between gray resistance and green trendline.

ALGOUSDT Bullish Harmonic ReversalALGOUSDT if bounces off of our trendline towards upside can give us a good entry at our Buy Stop level with good risk & reward Ratio.

A Simple Quick Trade to 2x Profit on ALGO USDTDear Tradingview family,
Symbol: #ALGO_USDT
Strategy: #Trend_TRADING #Trendline #Support_Resistance
Indicators: #Price_Action. #Chart_patterns #Trendline #Support_Resistance
Anchor Time: 1 Hours
Trading Time Frame: 15 Mins
Trade Call Type: #LONG.
Order Type: BUY LIMIT
Entry: BUY when Price test the trendline.
Entry price: 0.2180
Take Profit: 0.2210
Stop Loss: 0.2270
RRR- 1:2
Methodology:
As a professional and experienced forex, crypto and stocks trader, I will be using a rigorous methodology that involves analyzing the price action and key levels and using a combination of indicators, harmonic chart patterns and chart patterns. I will be looking for potential trendlines , support & resistance levels where the price action may reverse and using our indicators to confirm the validity of our analysis. Based on my analysis, I will then determine the optimal entry and exit points for our trade, as well as the appropriate stop loss level to manage risk.
Conclusion:
Based on our analysis, I believe that there is a potential trading opportunity for a LONG trade.
Risk Assessment:
Conservative Traders risk 0.5% to 1.5%, moderator traders risk 1.6% to 3.5% and aggressive traders risk 3.6% to 5% of their account per trade.
Please use Position size calculator to calculate your risk per trade.
Overall, I believe this setup has a good chance of success based on the technical analysis , but as always, it's important to monitor the price action closely and adjust the trade if necessary based on new information.
