SELL SETUP ON ALGOUSDTAccording to 4Hr Time frame trend the market is Bearish signal on Algo , I am expecting the Target as mentioned in chart. Don't use leverage more than 3X. This is not the financial Idea.
ALGOUSDT trade ideas

algo can go upHi, dear traders. how are you ? Today we have a viewpoint to BUY/LONG the ALGO symbol.
For risk management, please don't forget stop loss and capital management
When we reach the first target, save some profit and then change the stop to entry
Comment if you have any questions
Thank You

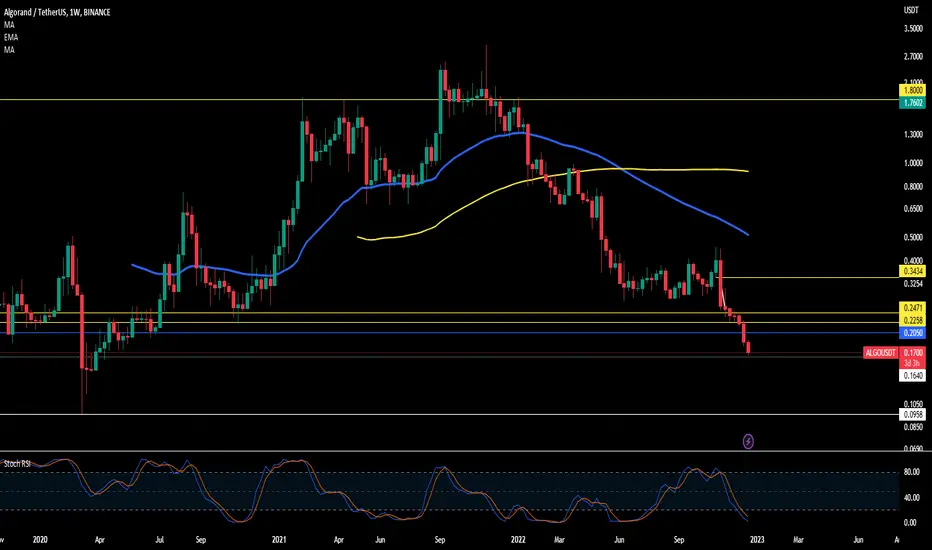
Buy yourself some ALGO for ChristmasAlgorand is one of the most sustainable blockchains.
Algorand was always my favorite blockchain. And it will always be my favorite coin to invest in.
Technical Analysis speaking, ALGO is trading at the bottom, it could go lower, but this is still a very good entry. And also, there are reversal signs with ALGOUSD when you look at the 1H chart.
Long term plan is to buy a small among of ALGO here and then buy some more at $0.1 (if we ever get there). And the short-term plan is to go LONG here with a tight stop-loss.
Long Scalping Setup:
Entry: 0.17x
Sl: 0.16
Tp: 0.19

Long ALGOUSD nowLonging ALGO with a tight stop-loss.
Or buy some spot for a safer option.
Entry: 0.17x
Sl: 0.16
Tp: 0.19

ALGOVery simple ... Very clear!
Everything is marked on the chart.
This is my personal opinion. Please do not trade based on my analysis and data.

$ALGOhello old friend
sl .1634
target .2050
had promised myself to long this here
12 cents next zoi if we loose this
ALGOIdea: The price dropped to a critical support level. The price is in the oversold zone. A buy signal hints at a possible price rebound to the nearest resistance. The price must break through the falling channel for a trend reversal

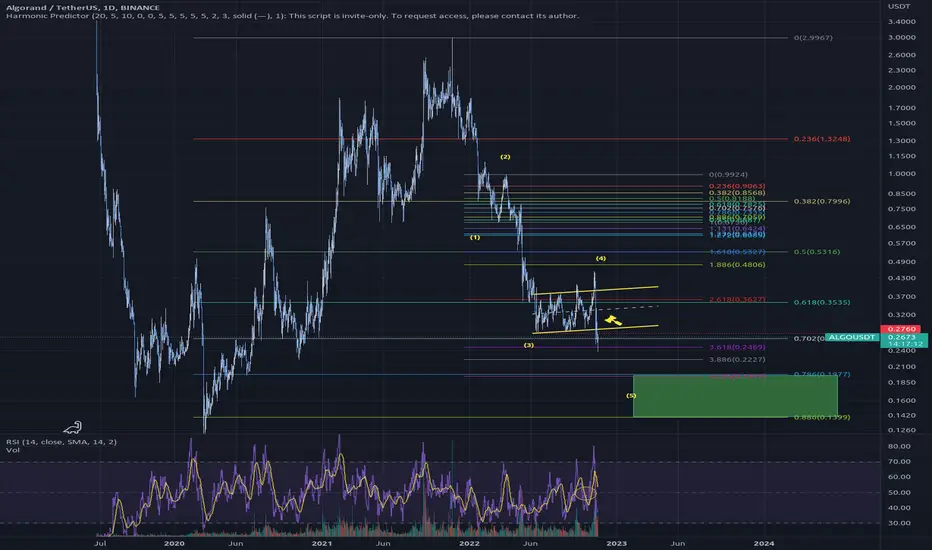
ALGOUSDT - Bearish below 0.2025Here's a quick take on ALGOUSDT - Not a whole lot to discuss here other than ALGO has fallen below a major support level at 0.2025 which was established in late 2019 and early 2020 during the covid dump.
A 5 wave structure can be seen on the way down with wave 4 retracing internally only roughly 23.6% of the way to another key level around 45 cents.
I would expect a significant bottom to be found if it goes to 14 cents. Otherwise, if it can close a daily candle above 0.2025, then I belive it'll go to the next resistance level within a couple days.

ALGO/USDT waiting for breakdownHey colleagues
Another one we are going to look at is ALGO token. We see a good possibility for this coin to go or lower levels once breaking the level of $0.188. Breaking that level will result the bearish movement towards lower levels. We also see that BB indicator path is getting tighter so some sort of movement should happen sooner or later.
If you like ideas provided by our team you can show us your support by liking and commenting.
Yours Sincerely,
Swallow Team 🔱
Disclamer:
We are not financial advisors. The content that we share on this website are for educational purposes and are our own personal opinions.

ALGOUSDT whats next?Hello Birdies,
This is a long term analysis, as we have marked the flip resistance in red ALGO should test it in order to have a pump.
Algo Approaching it fast and after this it will be available in 96%-97% discount.

ALGO - Long Still long ALGO, have added on significant price declines. Downside scenario in yellow rectangle where I will be accumulating again.
Looking for ATH+ in a few months, stay the course
Not investment advice

ALGO / USDT technical analysis and price prediction (Binance)Hello,
Today I will take a look at the ALGO / USDT pair on Binance in 4h timeframe. Algorand (ALGO) is today trading at $0.21, and we can see that it is in a downtrend (bearish momentum). According to historic price levels, the expected demand zone is at approximately $0.20. The supply zone is sitting around the price of $0.25. I can see that we are inside a descending trading channel and that we are moving in the direction of a historically very strong demand zone around $0.20. If we hit the price of $0.20, then this is an excellent, almost perfect position for opening a BUY/LONG position (still be careful because of the market conditions, we are still in a bear market). If you will enter trade at the price of $0.20, then you can expect the next targets to be for the short term at $0.25 and later at $0.30. In the case of the Cup and Handle trading pattern, I recommend entering at $0.25 after confirmation, otherwise not. I am expecting a bullish movement for ALGO at the price of $0.20, but just for the short term. Don't forget that we are still in a bear market and there are no signs of a major reversal of the trend. Trend is your friend :) If we break the expected demand zone, we can expect the price to continue falling, and the lowest level for ALGO is around $0.14 from March 2020, but I don't believe this scenario will occur.
Have a fantastic day and make the most of it.
Greetings,
BF

Algo Hammer incomingNew low = new leg = new problem!
2.618 on w3? 4.236 on w5, simple as that.
Ideally bounce right off that major 0.886
Discounts ahead!
Hold my beer pls
----
No financial advice, do your own research, don't be stupid
Algo potential gap fillI entered a trade on algo seeing a diamond. It may not clear but will be drawn to that liquidity void.
Long'd 0.2158, sl 0.2151, tp into the gap fill.
Not a great setup given we're going into the fed meet but just sharing some little scalps. Bet small on these. More to stay engaged and have some fun than big money making setup.

algo retest failure?Holding algo short yet again for the same movement captured earlier. Looks confirmed but be careful here.
Kind of assuming you're following my ideas if you're reading this, but have a look for yourself on the trade setup. Watch btc, keep risk management tight.

ALGOUSDT | "Power Of 3"Quick analysis on a textbook bullish "Power of 3" setup on ALGOUSDT
What is "Power of 3"
- Power of 3 setups occur when "smart/big" money is building a position and creating liquidity. Setups can be seen with bullish / bearish scenarios, today we will be digging into a bullish setup.
- While retail can enter positions as orderbook allows, smart money must use more complex methods to build a position. In a bullish scenario we can observe an accumulation zone, price will typically chop in a short range causing traders' bias/positions to flip flop, this is where smart money is building the bulk of their position. In the manipulation zone, price consolidates below a key broken point which will provoke seller/short interest, the added pressure allows smart money to further build the rest of their long position. Once smart money is positioned they want to provoke buyer/long interest (a reclaim of the broken S/R), this is where the expansion phase can begin. There is little to no resistance during the expansion phase because the bulk of short/sell pressure has already been absorbed, because of this, expansion can be quick and harsh.
This is just a very quick summary, I urge you to DYOR on "Power of 3" setups and come to your own conclusions/plan
My Plan for this scenario
- Enter long on a sweep of the manipulation/consolidation lows (i.e. 0.22 - 0.2180), or reclaim of the broken swing S/R
- T/P at 0.2750, however, a reclaim of the the monthly open will be key for confirmation of continuation. Reclaim 0.2750 and I will be eyeing further T/P toward liquidity at the broader range highs (marked on chart)
- Invalidation = clean break/close below range lows, or a breakdown on BTC

ALGO CAN DROP MOREI hope you are fine.
I have identified a diamond diametric for this symbol in this time frame. It seems that only the g wave of this diametric remains, which can move down after completion.
The red resistance box seems like a good place to end this diametric

Accumulate ALGOEllo dear kripto fukers!
I am going to accumulate $ALGO in heavy mode.
The zones ill be buying is between 0.20-0.18$ with a some % of funds saved incase it dump further lower ill add more quantity.
Keep accumulating for long term!

ALGORANDALGORAND POSSIBLE TRADE SETUP
Algo has been forming a BEAR FLAG. It broke out recently and now making a RISING WEDGE on the way to retesting the STL turned into RTL. Both the pattern is BEARISH. Ideal breakout targets are given in the chart.
SL: 0.2308 or little bit over depending on your risk appetite.
Non Financial advise. Trade at your own risk. Do your own research.
Use proper position sizing & take proper entry.

ALGOUSDTIt is expected that the rise to the specified areas will be a corrective rise, not an impulse, including the drainage of another strong last downward process


ALGO gap fill scrubbed out.Working on this alert and it helped me catch a change of character to enter a short early. ATOM is pressing into the support zone now, I took some profit here.
If it breaks it'll potentially run down towards 0.22.
Can't predict the future, but one for your watch list.
Fear into the fed meeting - 25-50bps priced in but the cpi data may make the market go short fast, and especially if they hike another 50bps.

Algo is planning for a riseHello Traders!
Welcome back to another episode with Analyst Aadil1000x.
Today we are setting a buy limit in Algo from the key reversal Area. This rise will move at least 2% and the final target will give us a 1:6 Risk reward.
Algo Buy Limit 0.2206
Stoploss 0.2190(-0.73%)
Target 1, 0.2252(+2.1%)
Final Target 0.2306(+4.56%)
Don't forget to hit the like button and follow to stay connected.
