Algo in an ascending broadening wedge- bearish distribution formation
- pattern present on the RSI as well
- not the only alt with such a signature
- confirmation of the pattern with a daily close below 0.34 cents with a target roughly 30% lower
ALGOUSDT trade ideas

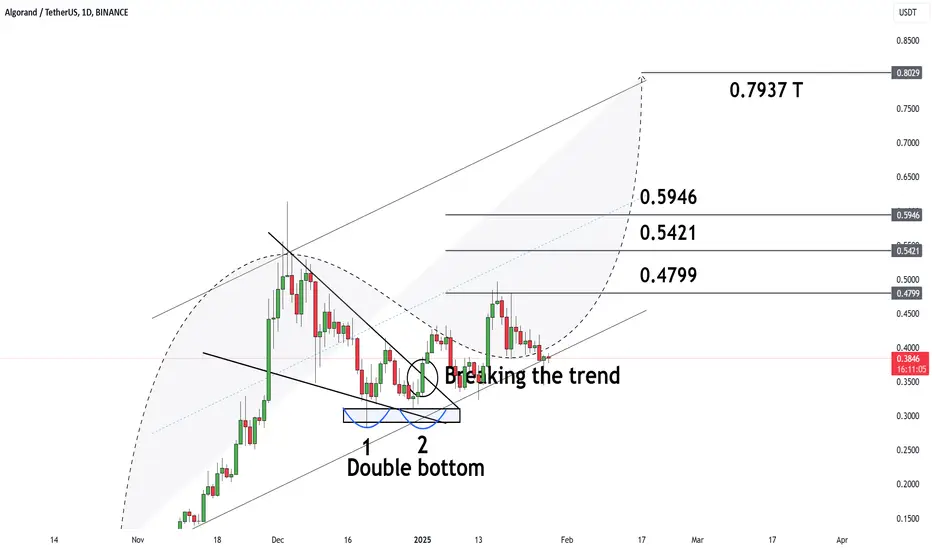
ALGO Long Spot OpportunityMarket Context:
ALGO has reached a key support level, offering a strong risk-to-reward opportunity for a long spot position. Given current price action, this level could act as a launchpad for a move higher.
Trade Details:
Entry Zone: $0.32 - $0.35 (support area)
Take Profit Targets:
$0.48 - $0.53
$0.70 - $0.80
Stop Loss: Just below $0.30
This trade aligns with ALGO’s structure, aiming for a rebound from support into key resistance levels. Stay disciplined with risk management! 📈

ALGO/USDT 4H breaking its downtrend or not?ALGO/USDT is re-testing its downtrend on the 4H-chart. Let’s see if it will be able to break it upwards this time

ALGOUSDT BEARISHI analyzed ALGOUSDT a few days ago as well, and it was bullish at that time. However, after a significant decline, I believe it may fall again, but probably not sharply.
Note: My ideas are not intended for any type of scalping or scalpers!
Here are some of my ideas (not selected!) :
Full list of my ideas are here:
www.tradingview.com

ALGORAND 1 day CHARTING also gives an indicator sideways Analyzing the 1-day chart, we observe a potential Head and Shoulders pattern emerging, indicating a possible upper momentum reversal. However, an alternative scenario suggests a Head and Shoulders pattern on a downtrend reversal, contingent upon a failure to breach the critical resistance level at 44.65.
Key points to watch:
Resistance level: 44.65
Pattern validity: contingent on breakout or rejection
A breakout above 44.65 could validate the upper momentum reversal, while a rejection may confirm the downtrend reversal scenario.

ALGORAND 45 MIN CHART could see potential break or downAnalyzing the 45-minute chart, we observe a potential Head and Shoulders pattern emerging, indicating a possible upper momentum reversal. However, an alternative scenario suggests a Head and Shoulders pattern on a downtrend reversal, contingent upon a failure to breach the critical resistance level at 44.65.
Key points to watch:
Resistance level: 44.65
Pattern validity: contingent on breakout or rejection
A breakout above 44.65 could validate the upper momentum reversal, while a rejection may confirm the downtrend reversal scenario."


ALGOUSDT - bullish pennanthi traders,
Recently we shared this idea where we expect the price of ALGO to rise:
There's not much changed but the price has been forming the bullish pennant.
Anyway, all the ways lead to 0,70$
Patience required. However, in March or April, ALGO should be traded around 0,70$.
GOOD luck

#ALGO/USDT #ALGO
The price is moving in a descending channel on the 1-hour frame and is adhering to it well and is heading to break it strongly upwards
We have a bounce from the lower limit of the descending channel, this support is at a price of 0.3500
We have a downtrend on the RSI indicator that is about to be broken, which supports the rise
We have a trend to stabilize above the moving average 100
Entry price 0.3533
First target 0.4080
Second target 0.4381
Third target 0.4753

#ALGO/USDT Ready to go higher#ALGO
The price is moving in a descending channel on the 1-hour frame and sticking to it well
We have a bounce from the lower limit of the descending channel, this support is at 0.4064
We have a downtrend on the RSI indicator that is about to be broken, which supports the rise
We have a trend to stabilize above the moving average 100
Entry price 0.4313
First target 0.4475
Second target 0.4593
Third target 0.4960

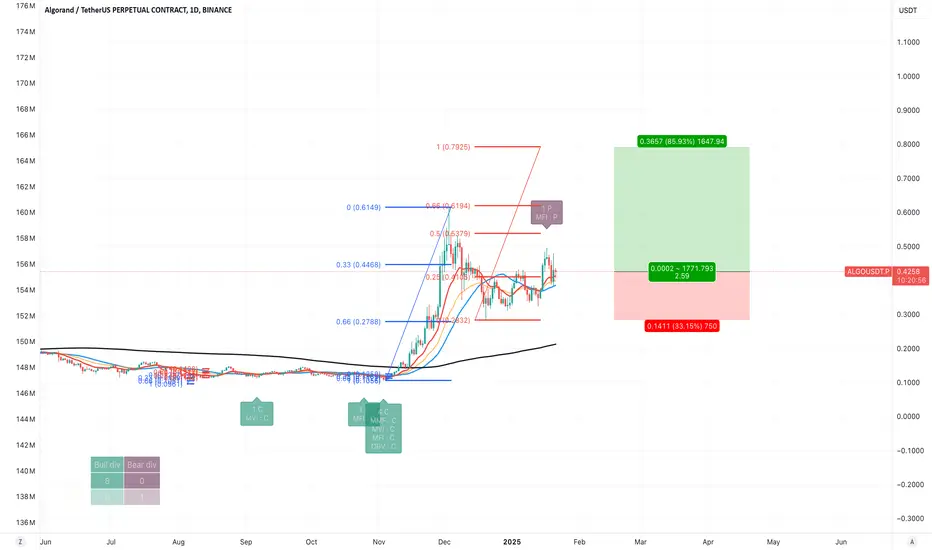
ALGO Watch for the next move
#ALGO Price is testing the 0.618 Fibonacci support, setting up for a potential bullish reversal 🐃
Accumulation in this zone could lead to a strong breakout toward key resistance levels 📈
🎯 Target 1: $0.5641
🎯 Target 2: $0.6697
🎯 Target 3: $0.7693

Algorand middle term targetsAlgorand middle term targets BINANCE:ALGOUSDT
Possible Targets and explanation idea
➡️We already sweep covid historical march 2020 low
➡️On a W tf we can see money inflow based on my Money Power indicator
➡️Perfect scenario with test of Buy line of my Take Profit indicator
➡️Target will be break out of downtrend line and test with full fill around 0.53$ monthly FVG.
Hope you enjoyed the content I created, You can support with your likes and comments this idea so more people can watch!
✅Disclaimer: Please be aware of the risks involved in trading. This idea was made for educational purposes only not for financial Investment Purposes.
---
• Look at my ideas about interesting altcoins in the related section down below ↓
• For more ideas please hit "Like" and "Follow"!

ALGO Yearly RangeBINANCE:ALGOUSDT
Possible Targets and explanation idea
➡️If we take a look on yearly chart we just got a simple range
➡️Top. Bottom at 0.0958. 2 test of equilibrium End of hype
➡️Crashed and formed historical lower low and deviation of range 0.0901
➡️Bullish road to 2 main monthly gaps and euphoria to deviation at the top 3.45$
➡️That time or we will break deviation and going higher or come back in a range again
Hope you enjoyed the content I created, You can support with your likes and comments this idea so more people can watch!
✅Disclaimer: Please be aware of the risks involved in trading. This idea was made for educational purposes only not for financial Investment Purposes.
---
• Look at my ideas about interesting altcoins in the related section down below ↓
• For more ideas please hit "Like" and "Follow"!

ALGO plan for 2023✅Before we start to discuss, I would be glad if you share your opinion on this post's comment section and hit the like button if you enjoyed it.
Thank you.
We don't need to draw a lot of lines on a charts. Here is weekly timeframe and everything what you should know about Algorand price action for 2023
Possible Targets and explanation idea
➡️Weekly chart. Based on Take profit indicator we traded long time period under fundamental price.
➡️Its a Fib trend extension not a retracement. By this fib from the top we came in exactly to 0.618 lvl
➡️First block its a Monthly gap. Second block its a weekly gap which we most likely come to trade
➡️Take profit line now at 1.13 and exit line over than 0 level 1.27
➡️Most likely we can see at least move to 0.23 level by fib then retest buy line and take profit line before 2024/2025 bull run
Hope you enjoyed the content I created, You can support with your likes and comments this idea so more people can watch!
✅Disclaimer: Please be aware of the risks involved in trading. This idea was made for educational purposes only not for financial Investment Purposes.
---
• Look at my ideas about interesting altcoins in the related section down below ↓
• For more ideas please hit "Like" and "Follow"!

Algo pump before World Cup in Qatar?BINANCE:ALGOUSDT
✅Before we start to discuss, I would be glad if you share your opinion on this post's comment section and hit the like button if you enjoyed it.
Thank you.
Algo is official partner FIFA, and in next month we will see major football event last 6 years. And its first time we will see World Cup championship in Qatar and in autumn (before it always was in June)
The idea is, hype around Algo and coins like CHZ bring a lot of attention to this coin.
Possible Targets and explanation
➡️Since January step by step big players accumulate ALGO (you can see on Direction indicator)
➡️We trade in -0.27 zone by fib
➡️More than 230 Days in accumulation phase
➡️Got a not strong but first signal to buy on D1 timeframe
➡️Marked first possible target to take profit.
➡️Daily downtrend line retested.
Hope you enjoyed the content I created, You can support with your likes and comments this idea so more people can watch!
✅Disclaimer: Please be aware of the risks involved in trading. This idea was made for educational purposes only not for financial Investment Purposes.
* Look at my ideas about interesting altcoins in the related section down below ↓
* For more ideas please hit "Like" and "Follow"!

Measured move setting up on ALGO/USDTWhat it says in the title. I reckon there is a measured move setting up on the daily chat with a good rr
ALGO at a Breaking Point – Will Bulls Push Through?Yello, Paradisers! Have you been keeping an eye on #ALGO’s recent rally?
💎After breaking out of the converging triangle pattern, it looked like the bulls were ready to take over. But now, momentum seems to be fading as #ALGOUSDT tests a critical challenging zone—a level that has repeatedly crushed hyper-bullish excitement. So, what’s next? Could a breakout finally happen, or are we about to see a deeper correction? Let’s break it down!
💎Currently, ALGO is hovering between $0.430 and $0.420, an important short-term breakout support zone. The next few hours are going to be crucial for bulls. If they can hold this range, ALGO has a solid chance to retest the challenging zone once again. However, if this key support fails to hold, the price will likely drop toward the ascending support level below, where a stronger base is positioned. This is a strong line of defense for the bulls.
💎Now, here’s the game-changer: for the bulls to truly take control, they must break above the challenging zone. This is not just any resistance—it’s reinforced by the Golden Fibonacci level and a strong horizontal resistance. Breaking this zone would be a major turning point, giving the bulls momentum to aim toward the next major target of $0.5950–$0.6150. This is a strong resistance region which represents ALGO’s 52-week high—a spot where significant selling pressure could emerge. If bulls aren’t careful, this area might trigger a pullback before any further upside can develop.
Patience and discipline are key here, Paradisers. The market often tests both bulls and bears before making decisive moves, so stay vigilant.
MyCryptoParadise
iFeel the success🌴


ALGOUSDT %150 HUGE VOLUME SPIKE!Green Line and Blue Box: Excellent Buy Zones
Both the green line and the blue box are thoroughly analyzed and show tremendous potential.
Highlights:
Green Line: A critical support level—simple yet effective. Buyers are likely to step in here.
Blue Box: Carefully selected using the best tools: volume footprint, volume profile, CDV, and liquidity heatmap. It’s a high-probability zone.
Buyer Confirmation: Early signs of buyer activity make these levels even more compelling.
Key Observations:
"The blue box is very carefully picked using volume footprint, volume profile, cumulative delta volume, and liquidity heatmap. When trading this zone, I will look for buyers and upward market structure breaks in lower time frames for confirmation."
This setup looks promising, and I’m optimistic about its potential. Let’s watch for confirmation before acting! 🚀
Let me tell you, this is something special. These insights, these setups—they’re not just good; they’re game-changers. I've spent years refining my approach, and the results speak for themselves. People are always asking, "How do you spot these opportunities?" It’s simple: experience, clarity, and a focus on high-probability moves.
Want to know how I use heatmaps, cumulative volume delta, and volume footprint techniques to find demand zones with precision? I’m happy to share—just send me a message. No cost, no catch. I believe in helping people make smarter decisions.
Here are some of my recent analyses. Each one highlights key opportunities:
🚀 RENDERUSDT: Strategic Support Zones at the Blue Boxes +%45 Reaction
🎯 PUNDIXUSDT: Huge Opportunity | 250% Volume Spike - %60 Reaction Sniper Entry
🌐 CryptoMarkets TOTAL2: Support Zone
🚀 GMTUSDT: %35 FAST REJECTION FROM THE RED BOX
🎯 ZENUSDT.P: Patience & Profitability | %230 Reaction from the Sniper Entry
🎯 DEXEUSDT %180 Reaction with %9 Stop
🐶 DOGEUSDT.P: Next Move
🎨 RENDERUSDT.P: Opportunity of the Month
💎 ETHUSDT.P: Where to Retrace
🟢 BNBUSDT.P: Potential Surge
📊 BTC Dominance: Reaction Zone
🌊 WAVESUSDT.P: Demand Zone Potential
🟣 UNIUSDT.P: Long-Term Trade
🔵 XRPUSDT.P: Entry Zones
🔗 LINKUSDT.P: Follow The River
📈 BTCUSDT.P: Two Key Demand Zones
🟩 POLUSDT: Bullish Momentum
🌟 PENDLEUSDT.P: Where Opportunity Meets Precision
🔥 BTCUSDT.P: Liquidation of Highly Leveraged Longs
🌊 SOLUSDT.P: SOL's Dip - Your Opportunity
🐸 1000PEPEUSDT.P: Prime Bounce Zone Unlocked
🚀 ETHUSDT.P: Set to Explode - Don't Miss This Game Changer
🤖 IQUSDT: Smart Plan
⚡️ PONDUSDT: A Trade Not Taken Is Better Than a Losing One
💼 STMXUSDT: 2 Buying Areas
🐢 TURBOUSDT: Buy Zones and Buyer Presence
🌍 ICPUSDT.P: Massive Upside Potential | Check the Trade Update For Seeing Results
🟠 IDEXUSDT: Spot Buy Area | %26 Profit if You Trade with MSB
📌 USUALUSDT: Buyers Are Active + %70 Profit in Total
🌟 FORTHUSDT: Sniper Entry +%26 Reaction
🐳 QKCUSDT: Sniper Entry +%57 Reaction
📊 BTC.D: Retest of Key Area Highly Likely
This list? It’s just a small piece of what I’ve been working on. There’s so much more. Go check my profile, see the results for yourself. My goal is simple: provide value and help you win. If you’ve got questions, I’ve got answers. Let’s get to work!

HBARUSDT UPDATEALGOUSDT is a cryptocurrency with a current price of $0.3900. Its target price is $0.5500, indicating a potential 50%+ gain. The pattern is a Bullish Pennant, a continuation pattern signaling a potential breakout. This pattern suggests a brief consolidation before a strong upward move. The Bullish Pennant is a positive signal, indicating a potential price surge. Investors are optimistic about ALGOUSDT's future performance. The current price may be a buying opportunity. Reaching the target price would result in significant returns. The Bullish Pennant pattern typically leads to a strong upward move. ALGOUSDT is poised for a potential breakout.

#ALGO Combining Fundamentals with Risk ManagementDescription:
Discover a comprehensive trading strategy for ALGO (Algorand) that focuses on fundamental analysis and robust risk management. Algorand is a high-performance blockchain known for its speed, security, and decentralization, making it a promising asset in the crypto space. This strategy emphasizes understanding ALGO's fundamentals, including its growing adoption in decentralized finance (DeFi), partnerships with institutions, and its unique Pure Proof-of-Stake (PPoS) consensus mechanism.
Key Fundamentals:
Scalability and Speed: ALGO's blockchain can process thousands of transactions per second, making it a strong contender for enterprise adoption.
Institutional Backing: Algorand has secured partnerships with governments, universities, and financial institutions, enhancing its credibility.
Eco-Friendly: ALGO's PPoS mechanism is energy-efficient, aligning with the growing demand for sustainable blockchain solutions.
Disclaimer:
Cryptocurrency trading involves significant risk and may not be suitable for all investors. The content provided is for educational purposes only and should not be considered financial advice. Always conduct your own research and consult with a professional before making any investment decisions. Past performance is not indicative of future results.
By combining ALGO's strong fundamentals with disciplined risk management, this strategy aims to help traders navigate the volatile crypto market effectively. Stay informed, trade responsibly, and always prioritize risk management.

ALGOUSDT: Ready to Surge or Poised for a Pullback?A Crucial Moment for ALGO: Overbought or Breakout Opportunity?
Algorand (ALGO) finds itself at a pivotal juncture, trading at $0.3959, a solid 49% dip from its historical peak of $0.789 recorded in May 2022. The current price action is bolstered by elevated buy volumes, yet the RSI of 71.4 teeters on the edge of overbought territory. As the market contemplates its next move, key resistance looms at $0.4219, while the nearest support at $0.368 offers a potential safety net for bulls.
Intriguingly, ALGO is riding a wave of increasing momentum, bolstered by recent bullish patterns such as the "Increased Buy Volumes" observed on multiple timeframes. The question remains: can this upward drive sustain, or will profit-taking trigger a correction?
Macro factors, including liquidity conditions and the broader crypto sentiment, further intensify this suspense. For traders and investors alike, this represents a classic moment of opportunity—one where preparation meets market potential.
Stay tuned to see if ALGOUSDT can conquer its resistance and deliver the breakout traders are watching for. Are you ready to seize the moment?
ALGOUSDT Roadmap: Pattern Chronicles That Shape the Chart
Here’s a trader’s treasure map—decoded from the sequence of historical patterns to help you navigate ALGOUSDT’s price movements like a pro. Each step confirms or denies the main direction, ensuring you get a clear view of what’s driving the action.
1. January 13, 2025, 14:00 UTC - Buy Volumes Max
The bullish tone was set with this pattern as ALGO opened at $0.3311, reached a high of $0.3459, and closed at $0.3414. The low-3-bars trigger was hit at $0.323, confirming the support strength. With subsequent patterns showing increasing buy pressure, this setup validated its bullish bias.
2. January 13, 2025, 10:00 UTC - Sell Volumes Max
A bearish turn emerged here, with the price opening at $0.3376 and closing lower at $0.3319. However, the trigger at $0.3296 acted as a temporary floor. The confirmation of bearish direction was short-lived, as the price rallied soon after, rendering this pattern a minor blip in the bullish narrative.
3. January 15, 2025, 00:00 UTC - VSA Manipulation Sell Pattern
ALGO stumbled, opening at $0.3724 and dipping to close at $0.3706. With a trigger at $0.3649, it flirted with downside risk but failed to break convincingly lower. Subsequent bullish patterns invalidated this bearish setup.
4. January 15, 2025, 02:00 UTC - Buy Volumes Max
The bulls charged again as ALGO opened at $0.3828 and closed higher at $0.3905, supported by a high-3-bars trigger of $0.395. This pattern reasserted the uptrend, with subsequent moves reinforcing the buying direction.
What Worked and What Didn’t
The "Buy Volumes Max" patterns on January 13 and January 15 validated their bullish signals as price continued to rise after hitting their triggers.
The "Sell Volumes Max" and "VSA Manipulation Sell Pattern" failed to hold their bearish direction, quickly overshadowed by stronger buying momentum.
Next Stop: Where Does ALGO Head From Here?
The current roadmap suggests a dominant bullish trend, with key resistance at $0.4219 in sight. Watch for patterns aligning with the buy-side bias and prepare for potential pullbacks to strong support levels like $0.368.
This journey isn’t just about looking back—it’s about staying ahead. Are you ready to spot the next pattern and ride the wave?
Technical & Price Action Analysis: Key Levels to Watch
When it comes to trading ALGOUSDT, knowing your support and resistance levels is half the battle. These levels act like road signs, guiding you through the market’s twists and turns. Here’s your cheat sheet:
Support Levels
$0.368 – A critical buffer zone where buyers have historically stepped in to halt downward pressure.
$0.3194 – A deeper safety net, but if this breaks, expect turbulence.
$0.309 – The last line of defense; if bulls can’t hold this, expect a bearish wave to pick up steam.
Resistance Levels
$0.4219 – First wall for bulls to break. A clean move above could signal a breakout.
$0.4653 – Mid-level resistance that could force a pullback before the next leg up.
$0.5007 – Psychological barrier; breaking this would be a strong buy signal.
Powerful Support Levels
$0.2145 – Major long-term support that could act as a magnet in a sharp correction.
$0.131 – A level so low it screams oversold if tested again.
$0.1091 – Bottom-of-the-barrel support; unlikely but not impossible in a market meltdown.
Powerful Resistance Levels
$0.0911 – An outlier from the distant past, relevant only in a full-on crash scenario.
Game Plan: Flip or Fade?
If these levels fail to hold or break convincingly, expect them to flip roles—support becomes resistance, and resistance turns into hurdles for bulls to clear. This behavior is textbook price action, so don’t get caught off guard!
Stick to your strategy, set your stops, and keep an eye on how these levels play out. The market is always moving, and so should you.
Trading Strategies Using Rays: Fibonacci Precision in Action
The "Rays from the Beginning of Movement" concept brings a revolutionary perspective to analyzing market dynamics. By leveraging Fibonacci-based geometric principles, these rays construct dynamic levels that act as guides for price movement, predicting possible reversals or continuations. Let’s dive into the strategies that can help you navigate these market movements.
Concept of Rays: Core Mechanics
Fibonacci Rays: Constructed from the start of a movement, these rays align with natural proportions and provide early signals of trend shifts or continuation.
Dynamic Levels: As price interacts with the rays, we observe how the asset respects or breaches these levels, signaling potential entry points.
Adaptability: Rays recalibrate when new patterns emerge, dynamically adjusting to the evolving market structure.
Intersection with Moving Averages: Moving averages (MA50, MA100, MA200, and MA233) act as dynamic support or resistance levels, enhancing ray-based analysis.
Scenarios for Trading
Optimistic Scenario (Bullish)
If price interacts with the ascending ray near $0.368 (support) and receives bullish confirmation, this zone can be a solid entry for long positions.
Targets:
First Target: $0.4219 – Price is expected to ride the upward ray to the next significant resistance level.
Second Target: $0.4653 – If momentum continues, this becomes the next checkpoint.
Dynamic Factor: If price breaks above MA50 ($0.3579) and aligns with the bullish ray, it further validates an optimistic continuation.
Pessimistic Scenario (Bearish)
If price interacts with the descending ray at $0.4219 (resistance) and shows bearish signals, this could mark the start of a corrective phase.
Targets:
First Target: $0.368 – A return to support near the lower ray boundary.
Second Target: $0.3194 – Deeper correction if bearish momentum intensifies.
Dynamic Factor: A breach below MA233 ($0.3714) confirms bearish pressure aligning with the ray structure.
Potential Trades Based on Key Levels
Long Trade from $0.368 to $0.4219: Ideal entry near the support ray with confirmation of upward momentum. First target aligns with dynamic resistance, providing a logical take-profit zone.
Short Trade from $0.4219 to $0.368: Entry at resistance ray after bearish interaction, targeting support as the logical exit.
Long Trade from $0.3194 to $0.368: Should the price dip to this deeper support, it offers a lower-risk entry for potential reversals.
Extended Bullish Trade from $0.4219 to $0.4653: Momentum traders can ride the wave to the next resistance ray after confirming strong buy pressure.
Key Takeaway
The VSA Rays on your chart are more than just lines—they are dynamic predictors of price movement. Remember, the strategy revolves around price interaction and confirmation at these levels. The move from one ray to the next sets your primary and extended trade targets, giving you a structured plan to approach the market with confidence.
Your Turn to Dive In!
Hey traders and investors, the market’s always evolving, and the best moves come from sharp insights and smart planning. Got questions or want to discuss the levels and rays we’ve analyzed? Drop your thoughts right in the comments—I’m here to connect and collaborate.
If you found this idea helpful, don’t forget to hit Boost and save it for later. Tracking price movement against my analysis is key to mastering those critical trade zones. Seeing how the market respects or breaks these levels will sharpen your edge over time.
By the way, the rays and levels you see are drawn using my custom indicator—an exclusive tool that automatically maps out everything. If you’re interested in getting access, shoot me a private message, and we can chat about the details.
Have a specific asset you want analyzed? I’m all ears. Some analyses I can share publicly, while others might be better as private insights, depending on your strategy. Let’s tailor the approach to what works best for you.
Remember, these rays work across all assets, and the market often moves in tune with them. If there’s something specific you’d like me to map out, just Boost this idea and let me know in the comments—I’ll do my best to include it.
Finally, don’t forget to follow me here on TradingView. This is where I share my latest ideas, and staying connected means you’ll never miss out. Let’s trade smarter together! 🚀
