ALGO Breaks Equilibrium, 400% Gains To ComeALGO breaks the channels equilibrium level, which set's itself up to test the upper resistance level for an additional 400% return. Should ALGO break above this, we could see upwards to 1000% return this cycle.
Algorand (ALGO) is a prominent blockchain platform designed to provide high performance, scalability, and robust security through its unique Pure Proof-of-Stake (PPoS) consensus mechanism. This approach enhances decentralization by allowing anyone holding ALGO tokens to participate in the network.
Unique Features and Industry Role
1. High Transaction Speed and Scalability: Algorand processes transactions in under four seconds and is capable of handling over 6,000 transactions per second, making it one of the fastest blockchains available. This is ideal for applications requiring quick and secure transactions, such as decentralized finance (DeFi) and enterprise solutions.
2. Sustainability: Algorand is a carbon-neutral blockchain, emphasizing eco-friendly operations through innovative consensus and energy-efficient practices.
3. Innovative Developer Tools: The launch of AlgoKit 2.0 introduces user-friendly development tools, integrating Python support for blockchain application creation. This positions Algorand as a platform accessible to developers with minimal blockchain expertise, potentially expanding its ecosystem further.
4. Advanced Upgrades: The move to a peer-to-peer structure improves communication between nodes, reducing reliance on centralized relay nodes and enhancing network resilience. These changes aim to foster decentralization and user engagement.
Recent Developments
1 . AlgoKit 2.0: Launched in 2024, it simplifies the development of decentralized applications (dApps) by incorporating debugging tools and secure coding frameworks.
2. Dynamic Round Times: Transactions per second (TPS) have been increased by approximately 10%, further optimizing performance.
3. Incentive Updates: The network plans to reward contributors to its consensus mechanism, encouraging higher participation and staking activity.
Market Metrics
Current Market Cap: Around $4 billion, positioning it among the leading blockchain projects.
Growth Potential: Despite a relatively modest market cap compared to giants like Ethereum, Algorand's strategic updates and eco-focus position it well for long-term growth.
Use Cases
Algorand is gaining traction in sectors such as:
Central Bank Digital Currencies (CBDCs): The platform has collaborated with various governments to explore blockchain-based digital currencies.
DeFi and NFTs: It supports a growing ecosystem of decentralized applications and digital collectibles.
Enterprise Solutions: Algorand is increasingly favored for projects requiring scalable and efficient blockchain infrastructure.
Future Outlook
With ongoing advancements and a commitment to developer accessibility, Algorand could attract a larger user base. While current price movements may not reflect its potential, the focus on innovation and incentives indicates a long-term growth trajectory. If adoption accelerates and the ecosystem continues to mature, Algorand could significantly expand its market share in the blockchain space.
ALGOUSDT trade ideas

Algo usdt 20% potential spot tradeALGO/USDT is showing a promising 20% potential in the spot market, supported by increasing trading activity and bullish sentiment. A breakout above key resistance levels could drive further upward momentum, making it an appealing short-term trade opportunity.

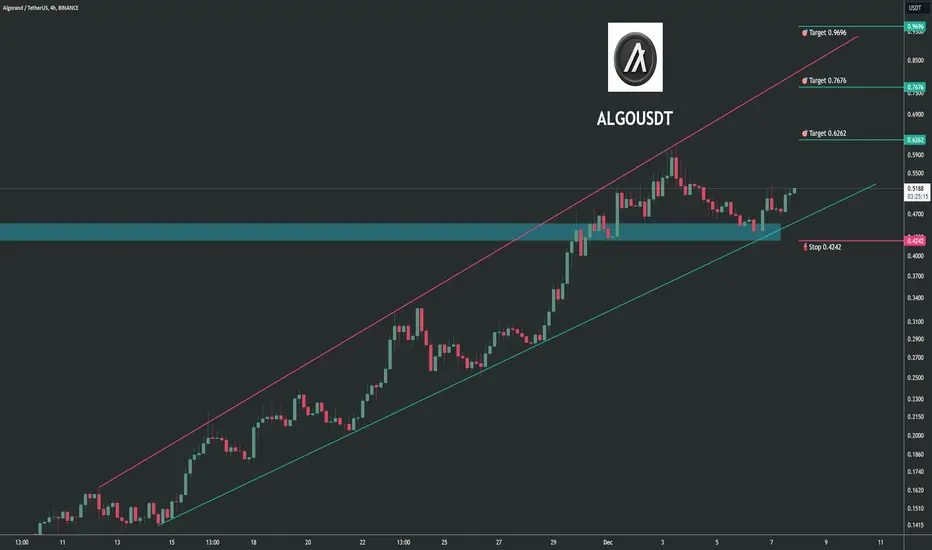
Trading opportunity for ALGOUSDTBased on technical factors there is a Buy position in :
📊 ALGOUSDT
🔵 Buy Now
🪫Stop loss 0.4242
🔋Target 1 0.6262
🔋Target 2 0.7676
🔋Target 3 0.9696
💸RISK : 1%
We hope it is profitable for you ❤️
Please support our activity with your likes👍 and comments📝
Algo Bullish Flag Algo BINANCE:ALGOUSDT can reach next target $0.7860. There is a Bullish Flag pattern. Algo was staying around 0.45 dollar for long time. it can turn back to game more powerful.


ALGO to the moonALGO using Elliot Wave Theory.
ALGO went through a brutal bear market but is now finally able to go through its 2nd bull cycle

$ALGO looking healthy on the 4H Algorand seems to be wanting to continue the bullish trend by forming a symmetrical triangle on the 4H timeframe, aiming a possible 37.17% breakout towards this local resistance level. Breaking this local resistance level would be important to continue the trend, but failing to do so would push Algorand back into the accumulation zone around 40 cents.

ALGOUSDT Uptrend Insight
BINANCE:ALGOUSDT has performed promising lately. Given the market uptrend, ALGO can continue its Bull-run by reacting to support level at its Fibonacci 0.5 or breaking previous High at Fibonacci 0.38 going upward.
Breaking below 0.4321 could trigger a downtrend or if supported at 0.3893 (Fibo 0.618) signal a weaker uptrend.

Long opportunity in ALGO/USDTIf the level 0.4933 breaks with 15 Min Green candle, there is an opportunity for long trade.
Disclaimer : I'm not recommending to take this entry. Do with your analysis too.
Reasons : -
. Trend line breakout.
. Falling wedge pattern.
After Breakout :-
Entry : 0.4933
TP : 0.5413
SL : 0.4616

ALGO - where to buy the diphi traders,
After reaching 0,60$ the price has been experiencing the pullback. Don't worry. It's normal as the RSI is super overbought.
We believe that it's not the end of the uptrend yet, but just an opportunity to buy the dip.
Buy the dip and enjoy the 85 % profit in the next few weeks.
Kind regards

algo 11$ by the end of 2029algo 3-4$ by the end of 2025
11$ by the end of 2029
fibonacci ext never misses


Looking at the monthly chart we can expect at least $2 ALGO$2 ALGO is only a month or month and a half away.
I think this is conservative, given how algo smart contracts were not yet live last cycle and with DT as president soon, USA based cryptos are poised to receive a boost across the board.
Im really looking for $3 - $4 but thats just me

#ALGO Algo looking good on HTF here.
double bottom kind of structure & levels line up interesting with HTF downtrend

Algorand Nears $0.45 Resistance: Breakout Targets $0.70 Algorand (ALGO) is experiencing a significant upward trend, with a 25% surge in its price over the past 24 hours. However, resistance levels around $0.45 and beyond may need to be breached for ALGO to maintain its bullish trajectory
Waiting to test the key resistance at $0.45, a breakout above this level could confirm entry opportunities. Targeting the resistance zone around $0.70.

ALGO ... this could be somethingHi guys,
Spotted this setup on ALGO, the target of the cup & handle is situated in the 0,67$ area.
As a "safe" trading setup we still need to wait for a breakout and retest of the 0,23$ area before taking action.
Always take risk management measures while trading ( set stops, maintain risk under 2% etc.).
I hope we all make it !

ALGO PumpAlgorand is one of the cryptos which has shown bigger gains in this bull pump.
There is a major resistance level in the 0.70 zone, which has been important since 2020. I believe this is the next target to the upside.
In terms of Elliott Waves, my primary count considers we are currently in gray wave 3.
Pullbacks are buying opportunities until we reach gray resistance. At that level I'd be more careful since we could see a deeper correction before continuation.

ALGO LongReason: Break out of Downtrend channel pattern. Above strong resistance zone. Chart looks bullish for it. Worth buy for short-mid term quick profits too.
Entry: 0.1218$ - 0.1170$
Targets: 0.1230$, 0.1260$, 0.1290$, 0.1320$, 0.1380$, 0.1450$, 0.1500$, 0.1550$
Stoploss: 0.1140$

Key Factors Driving ALGO's Potential Rise to $0.70We expect ALGO to continue its upward movement towards the $0.70 level if a combination of positive factors supports its price action. The first of these factors is an increase in buying momentum, which reflects strong demand for the currency driven by new investors or institutions looking to capitalize on the potential of the Algorand network.
Breaking technical resistance is another key factor. The currency needs to surpass the nearby resistance level of $0.50 with a strong close to pave the way towards $0.70. Indicators such as a rise in the Relative Strength Index (RSI) or a positive crossover of moving averages could further confirm this upward trend.
Additionally, support from the broader market is essential. If the cryptocurrency market experiences a general upward trend led by Bitcoin or Ethereum, ALGO could benefit from this momentum to achieve significant gains.
Lastly, positive news or new partnerships could act as a catalyst. Announcements about institutional partnerships or the adoption of Algorand's technologies in major projects could increase investor confidence and boost demand for the currency.
However, it is important to note that reaching the $0.70 level depends on the continuity of these supportive factors. Investors should be cautious of potential risks, such as sudden market fluctuations, and consider monitoring key support levels while employing stop-loss strategies to minimize potential losses.

#ALGOUSDT ( double bottom )According to the kinetic shape of the candles,
can hope for the formation of a double bottom pattern.
The middle line of the green channel at the red flash point
can be the entry boundary to the roof of the green channel.

ALGO/USDT - double bottom - retest and long trade potential
I had planned to enter the trade with a strong breakout and then a retest. Such a strong breakout is a positive indicator for a long trade to be taken. Now it's time to wait for the price to reach the breakout area. If this trade is stopped, I can plan a second long trade from the fibbonacci 0.618 region of the last wave with the 2-618 formation.

ALGOUSDT LONGThis is my random guess for ALGO this cycle. I am predicting a short term high of around $5 by the end of January 2025 and a final blow off top somewhere between $15 and $20 by October/November 2025. The volume for this move is massive and it would be very unwise to fade it IMO. I also don't think this is just old retail coming back. It might be because of the rumour that Trump has said there will be no capital gains on US cryptos (they have all gone parabolic in the last few weeks) or it might be because there is some big news coming. ALGO has been focusing on institutional and government adoption whilst the other L1s have been focusing on retail - maybe it will host a CBDC or something equivalent...

ALGOUSDT (Algorand) Updated till 29-11-24ALGOUSDT (Algorand) Daily timeframe range. its working like absolute beast here. with this volume outperforming many alts out there. pin point close to break 0.4562. a clean close above can push it to 0.6156 and beyond. recent support at 0.3328.
