ALGUSD trade ideas

ALGO with symmetrical triangle breakoutALGO with a symmetrical triangle breakout. I decided to mix it up and include some Elliot wave theory. It looks like the first impulse is over but the second impulse is just beginning. Mind you if it had the same market cap as ADA it'd be at $10.80 (at the time of this post)
Looks like we could be heading to the high 3's and maybe even break into the low 4's with Algorand.
*HYPOTHETICAL* Just want to see how it turns out when you combine wave theory with traditional TA, like h&s or triangles.
No bs, I am the most bullish out of every crypto out there. even bitcoin

ALGO | Close above 2.05 B U L L I S H ! ! ! Looking for this daily candle to close above the 2.05 for a retracement back tot he 2.05 area or 2.05 region. Short term higher lows for confirmation to long. Price hasn't closed above 2.05 since September 19th.
What are you seeing ? ? ?

ALGO going for ATH??If ALGO finally breaks its resistance at $2.26 we are probably going to see ALGO at its ATH again. But if it gets rejected again we're going to have a triple top and in result of that ALGO will fall to about $1.90 or below. Just keep an eye on ALGO!!!!!

Algorand is promising to touch 8 for next one monthAlgorand is promising to touch 8 for next one month

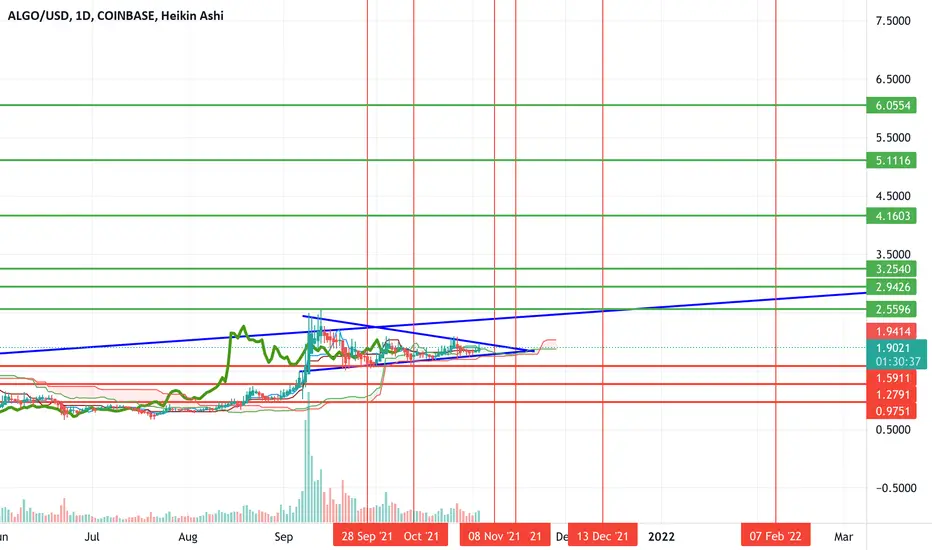
$ALGO targets $6 over the LT but w/ ST potential downside riskI think the next time we touch the blue trend line running through the middle of the chart, it should break. Which would give $algo great upside to the higher green targets w/ a potential of $6 as the final target. The key level to break on the upside is $2.56 (ATH) which would provide a path for continuation upwards.
However, the question is, what is the path to get there? I don't think the trade is as simple as it looks from the chart at the moment.
While there appears to be a flag that has formed on the chart, and the indicators are looking good, I think BTC could potentially take Algo down with it, if it were to fall.
I think the most likely scenario from here is that we break down from the flag (or break up and roll over) and find support at $.96-1.23 before the uptrend resumes. Reason being, that I'd have a hard time seeing Algo running straight up without retesting those lows first.
Let's see how it plays out. I added some key dates on the chart for changes in price action to watch.
AlgoBeen stocking up! look for entry if it retests previous levels. Algo is a great project. Follow me for more winning charts!

ALGORAND BREAKING OUT! Another resistance level breaking. In the words of @CryptoTrading_KenStandfield - the Altcoins are being pulled by Bitcoin's gravity.
I am seeing so many ALTS breaking out!
Target 1: $2.40
Target 2: $2.60 - $2.70
Come on the Alts!
Boom,
theRaggy

ALGO could be headed to $3Algorand crypto, symbol $ALGO, has a nice ascending triangle breakout on the daily timeframe (assuming prices hold as of this time). My target for this is around $3 USD. Volume looks good so far.
This is not financial advice, do your own research.


Algorand Elliott wave projection updateAnalysis based on Elliott wave projection and it is an update to an old idea
Black line is for exiting your position gradually

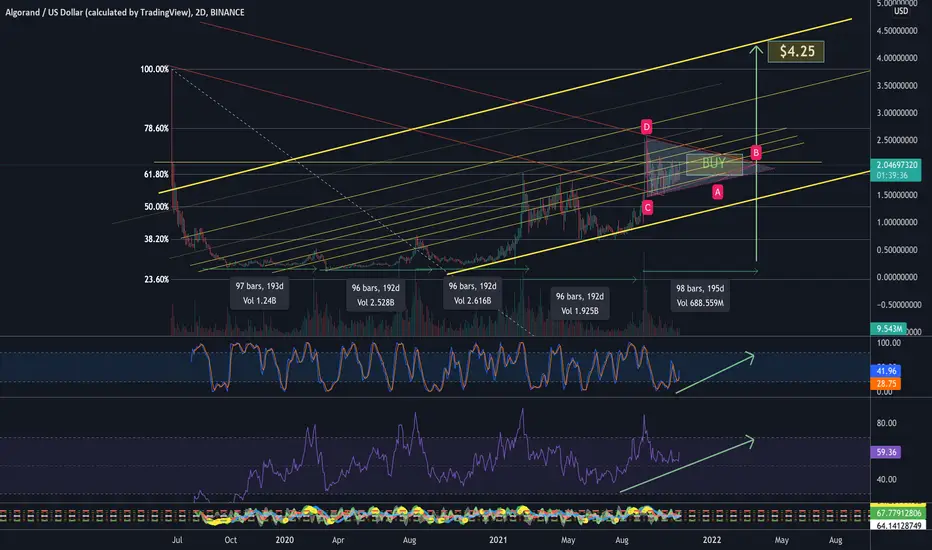
ALGO +100% by March 2022 $4.25We can see in this technical analisys that ALGO is repeating its moves every 192 days.
This would be the 5th time it is repating this.
So, what is this chart telling us?
You could see, on my previous update y that the flag was perfectly executed on the preditid time. We can see now that besides ALGO jumped 15% these past days it is in accumulation proccess, and those are just sign of strength. Collect gold nuggets!
There is not point to have your money sleeping there during the rest of the accumulation proccess or flag formation. You can use it for other projects in between, unless you decide to buy and leave it as a investment.
As a trader I would recommend you to buy at the next dip or just at the resistance level before the break out. This could be even at $2.20. You would still double your money in a short period of time.
There is a big fight between protocols since ETH sky rocketted. Every one is looking for the new "cheap" aquivalent ETH projects. Money is going to SOL, AVAX, ALGO, and many others.
DeFis are stuck at due to this fight and last month BTC dominance.
Despite all of this, news and toke updates..., charts talk by themselves.
I timed ALGO as you can see in the chart. 5 consecutive periods of aprox 192 days.
I hope this help you the get richer.
Apprecite the hard work by pressing like and feel happy to follow for updates.
Happy trading,
Raf
ALGO doing the move ?
ALGO seem to be breaking out of his triangle but i would stay cautious as long as we don't have a daily above 2.05$.
If it does close above then the plan would be to buy any retest of 1.95$ and target 2.5$ as 1st TP which would be what i would play since MACD daily is turning bullish.
If it close under then we would need to rethink the upper trendline of the pattern perhaps and exclude the price action of 10 to 12th september which is missleading.
Ideally we want a daily close at 2.1$ so both trendline would become potential support combine with the current resistance area 1.95$/2.05$
Let's see how this will play out


ALGO We are currently re-accumulating and holding the 61.8 of the previous swing high/low on the FIB retracement. I expect a 100% as first TP for this trade once ETH starts to slow down.
We must analyze and keep and eye on the higher lows printing. ON lower timeframes we are reaccumulating and are currently holding at the creek level. just showing many are holding their money which is a great sign. Algo announced new NFTs in their ecosystem 4 days ago. I expect this to be a huge move that can end at 10 dollars by the end of next year. Or, it can pull a Solana, lets see what the market blesses us with .
Any lower prices are meant to get bought up to accumulate coins before we get the money coming in from bigger buyers. Holding from 89 cents. 10 dollars TP will be the first sign of looking to start limiting.

I feel I am being generousAlgorands Flag right now.
This ecosystem is good but has a lack of developers right now.
More will be moving over soon and developing wallets. This is still in competition with other layer ones.

ALGO Coiled UpALGO coming to an end of this consolidation above the prior ATHs. Low and decreasing volume on this base signals selling pressure is coming down as sellers are being absorbed in the price range (blue line is 100 day average).
Looking for this to breakout next week.


ALGORAND against USD POS coinstaking, staking and staking!!
the creator
Silvio Micali is a professor of computer science at the Massachusetts Institute of Technology, and the founder of Algorand. He is a recipient of the Turing Award (in 2012) for his fundamental contributions to the theory and practice of secure two-party computation, electronic cash, cryptocurrencies and blockchain protocols. This makes him one of the foremost creators of crypto in the world.
Rank #20
Coin
On 373,858 watchlists
Algorand Price (ALGO)
$1.86
0.85%
0.00003044 BTC1.29%
0.0004137 ETH0.66%

$ALGO Symmetrical TriangleRSI is showing strength maintaining above the 46 level. The 50-day MA passed up through the 200-day MA signifying a Golden Cross.
MACD doesn't look the greatest but does appear to be moving in the right direction.
Scenario A: break-out of the triangle, zoom towards previous ATH, contend with it momentarily and then make new ATH
Scenario B: breakdown out of the triangle, fall towards 200-day MA or previous support.
Which scenario do you think is more likely?
Imagine when ALGO gets the market cap of ADA or SOL... Algorand would be at about $11 if that were the case based on current market caps at the time of this post.
Weekly Chart:

