alts coins RANDOMas we see in most alt coins and even in BTC we are expecting some retracement on last bearish swing ...
ALICEUSDT trade ideas

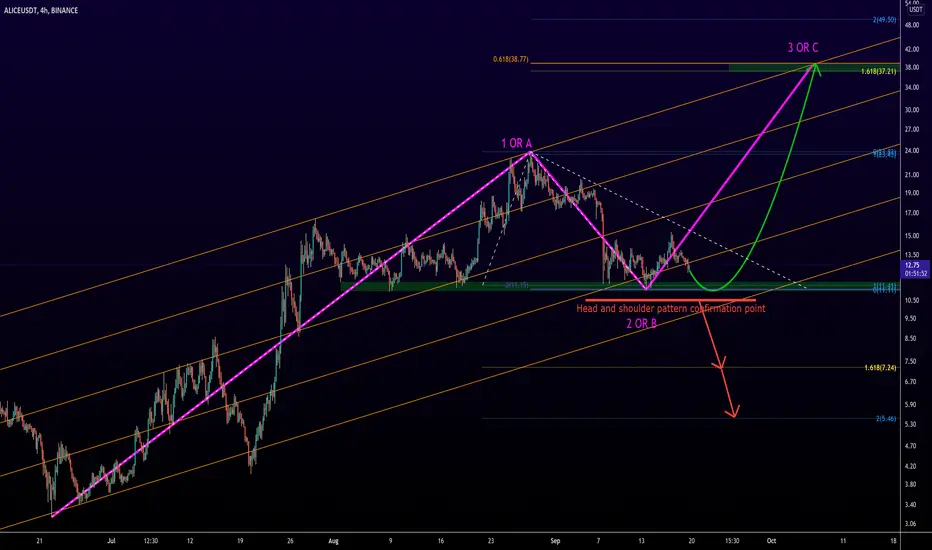
#ALICE 4H ANALYSIS#ALICE 4H ANALYSIS
Depending on the movement channel as well as the correction made, the price can be expected to rise to at least $ 37.
The upside of this uptrend is around $ 10.5.
A very important point about this loss limit is that if the loss limit is activated, we will have an approved head and shoulder pattern that can lead to a price drop to the range of $ 5.5-7.5.
ALICE , what to do ?hallo everyone .
there are 4 possible scenarios :
number 1 :
price consolidating in this range , either it breaks the top or the bottom of the channel.
number 2 :
the price breaks the local resistance and MA50 , rises to the strong resistance , comes back down will be in this range.
number 3 :
price breaks both resistances , and reaches the target of 161.80% Fibonacci which is 38 $.
number 4 :
price after consolidating in this range , will break the support and fall to the green line.
after all , in my opinion , it's more likely to break the local resistance in the following days and pump to the strong resistance , that time we'll decide either it goes down again or breaks the strong resistance ...
I'll keep y'all updated .
don't forget to hit the like !

ALICEUSDT is testing the daily resistance 🦐ALICEUSDT is testing the daily resistance. If the price is going to have a breakout, According to Plancton's strategy (check our Academy ), we can set a nice order
–––––
Follow the Shrimp 🦐
Keep in mind.
🟣 Purple structure -> Monthly structure.
🔴 Red structure -> Weekly structure.
🔵 Blue structure -> Daily structure.
🟡 Yellow structure -> 4h structure.
⚫️ Black structure -> <4h structure.


Alice USDT forming Breakout momentAlice Usdt forming a breakout moment.
As described in the drawing i would prefer to go long if breakout happens upside.
Entry price 3.77 Target 6.43 Stoploss 3.10
So It's a swing trade hence RR is taken accordingly 3:45
This is only for an educational purpose.
Do your own research.
Non financial advice.

Make Alice Great AgainAlice is under youravity-research monitoring, although recently there has been a very significant price change, it seems that $alice is still on its bullish path. But that doesn't mean it's something very promising because majors often range and shake out. Stay alert, when it falls I'll always be there. - stoploss
Cheers - youra


Alice 4h - Buy ChanceBuy under $13
Stop loss: $11.2
1st take profit: $15
2nd take profit: $17
Trend Key Points Indicator have been used to draw important key levels and key points.


aliceusdtI welcome comments and likes.
..........................................................................
Disclaimer: The given information on the chart and comments are not a Financial Advice.
Be carefull abaut your risk assessment...!!!
..........................................................................

#RESULTS# ALICE /USDT Quick Update, 1 month +150%I had to share the results of this idea, it was so perfect.
Look at these corrections on the exact trends, support and resistance
That's for my record


aliceusdtalice has completed bullish shark pattern .this whole area marked is demand zone .
NFA DYOR

ALICEUSDT. LONGTERM targetALICEUSDT weekly chart. This is what i see.
Alice's pullback is likely printed a right shoulder .
to make a huge ihns pattern (inverse head and shoulder).
It'll be a shaky climb. But holding it for a longterm, i think it's a good investment / good buy right now.
if you look closely at 4H timeframe . ALICEUSDT is having a bullish divergence .
so i think. this is an opportunity to accumulate.
target will follow the arrow.
waddya think?
*not financial advice


