Very likely x's on alpacaAlong with the pda and vin, alpaca may show good growth in the upcoming bullish cycle. This month, the token was not included in the delisting announcement, and an active set of positions began because it is in an extremely oversold position. Previously, many signals were left with attempts to return to 0.15, and this month there is a possibility of working out this goal under an optimistic scenario. At the moment, the main goal is an attempt to consolidate above 0.075, from where an increase in volatility is likely. When a new week or the second half of the month opens above the level, the reaction will not take long. I would like to draw your attention to the fact that, unlike vib and pda, this token has already changed the trend on the daily chart, which can lead to fairly stable growth.
ALPACAUSDT.P trade ideas

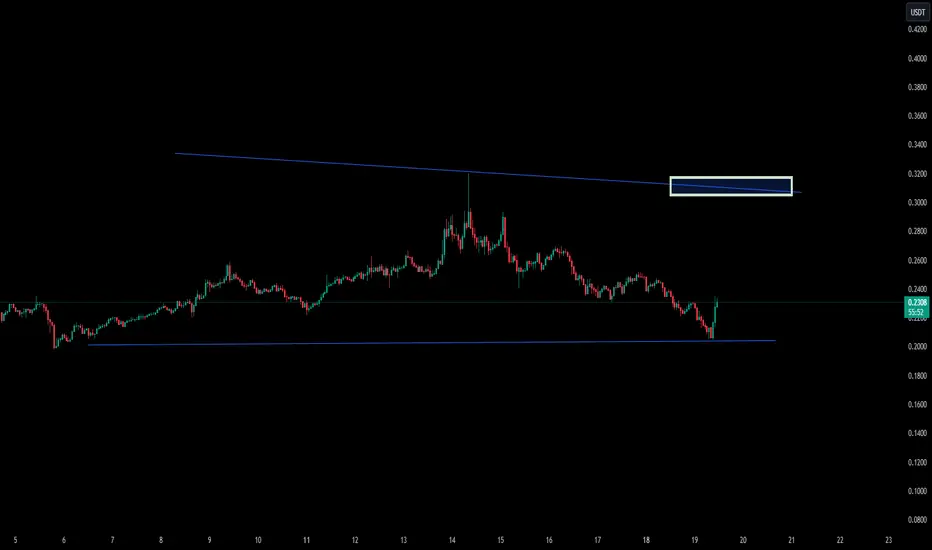
ALPACAUSDT – Looks Weak, But Patience is Key! ALPACAUSDT 🐻
“No need to rush—the blue box is the ideal short entry!”
🔥 Key Insights:
✅ ALPACA is Showing Weakness – Momentum is fading.
✅ Blue Box = Best Short Entry – No chasing, wait for confirmation.
✅ LTF Breakdown Needed – CDV + Volume Profile must align.
💡 The Smart Plan:
Wait for the Blue Box – Let price come to us.
Watch 15M & 1H for Down Breakouts – Smart money will signal the move.
No Confirmation, No Trade – We only take high-probability setups.
“Discipline = Profits—let’s trap liquidity before taking the trade!” 📉🔥
A tiny part of my runners:
🎯 ZENUSDT.P: Patience & Profitability | %230 Reaction from the Sniper Entry
🐶 DOGEUSDT.P: Next Move
🎨 RENDERUSDT.P: Opportunity of the Month
💎 ETHUSDT.P: Where to Retrace
🟢 BNBUSDT.P: Potential Surge
📊 BTC Dominance: Reaction Zone
🌊 WAVESUSDT.P: Demand Zone Potential
🟣 UNIUSDT.P: Long-Term Trade
🔵 XRPUSDT.P: Entry Zones
🔗 LINKUSDT.P: Follow The River
📈 BTCUSDT.P: Two Key Demand Zones
🟩 POLUSDT: Bullish Momentum
🌟 PENDLEUSDT.P: Where Opportunity Meets Precision
🔥 BTCUSDT.P: Liquidation of Highly Leveraged Longs
🌊 SOLUSDT.P: SOL's Dip - Your Opportunity
🐸 1000PEPEUSDT.P: Prime Bounce Zone Unlocked
🚀 ETHUSDT.P: Set to Explode - Don't Miss This Game Changer
🤖 IQUSDT: Smart Plan
⚡️ PONDUSDT: A Trade Not Taken Is Better Than a Losing One
💼 STMXUSDT: 2 Buying Areas
🐢 TURBOUSDT: Buy Zones and Buyer Presence
🌍 ICPUSDT.P: Massive Upside Potential | Check the Trade Update For Seeing Results
🟠 IDEXUSDT: Spot Buy Area | %26 Profit if You Trade with MSB
📌 USUALUSDT: Buyers Are Active + %70 Profit in Total
🌟 FORTHUSDT: Sniper Entry +%26 Reaction
🐳 QKCUSDT: Sniper Entry +%57 Reaction
📊 BTC.D: Retest of Key Area Highly Likely
I stopped adding to the list because it's kinda tiring to add 5-10 charts in every move but you can check my profile and see that it goes on..

Good moment for Buy ALPACAGood moment for Buy ALPACAUSDT. We are have "long time" to collect the sizes and first step of move up is ready. We again collect sizes and next step is good move up action. Good risk reward ratio. Will see...

ALPACAUSDT CHART ANALYSİS - EDUCATIONAL POSTConclusion
The NFT market is developing extremely fast, and the blockchain infrastructure has undergone significant changes over the past few years. However, today, there are still many questions about how the NFT market can function and in which areas non-fungible tokens can be used.
For example, one potential application of NFT is the blockchain recording of unique documents. Due to the reliability of the blockchain, diplomas, certificates, and various documents can be issued in NFT format, potentially helping to eliminate the risk of forgery.
NFTs are likely to have, and are already having, some impact on formats for creating and distributing content, and art objects. For now, however, it is primarily a trending investment tool for crypto enthusiasts around the world. The numerous possibilities of this technology will be revealed in the coming years.

Pullback to the second bottom on ALPACAAs we approach the middle of the quarter, there is an increase in purchases of altcoins, in preparation for which I recommended purchases in the second half of last week. To date, I have pleasantly shown the alpaca token, on the example of which I want to consider further scenarios for the development of events.
The token has opened an annual candle above the key level of 0.15, which gives a signal for a hike to the levels 0.25-35-50 . However, the market has been overbought since last year and there is still a possibility of further drawdown of the tops up to 75k and below for bitcoin. In this regard, a reliable scenario for altcoins is so far only a retest of the opening of the year with a further pullback to draw the second bottom, from where we can expect a more confident trend towards a reversal of the annual candle. In particular, for alpaca, the probability of a rollback prevails with an attempt to reverse the month again before closing the monthly candle. If a new monthly candle opens below 0.15 and, moreover, 0.14, growth may linger until the second half of March.
Today, a more interesting position is occupied by og vidt vib PDAs, which I primarily consider for storing funds in the mid-range due to the opening of the annual candle above key levels, which gives a signal for its bullish reversal in the future. The main goal for them, similar to alpaca, so far is a retest of the opening of the year followed by a rollback.
I am also considering uft wing slf burger ast quick pivx for scalping with a continuing growth potential of up to 30-50%.
Coins with the tag monitoring vite hard cream amb troy with a growth potential of up to 100%+ also retain a high potential for breakouts. Let me remind you that when working with these assets, I recommend keeping a short stop under the price in the first half of the week until noon to insure against delisting, or to hire them from the middle of the week.

ALPACA shortAlpaca Finance is the largest lending protocol allowing leveraged yield farming on Binance Smart Chain. It helps lenders earn safe and stable yields, and offers borrowers undercollateralized loans for leveraged yield farming positions, vastly multiplying their farming principals and resulting profits.
Holders: 77.64K
Total supply: 150.8M ALPACA
Max. supply: 188M ALPACA
Circulating supply: 150.8M ALPACA
Short target 0.14 usdt.
If We continue downwards, 0.08-0.10 usdt area.
Long target maximum 0.20 usdt.
This is only my idea guys.
This is not financial advice !
Please do your analysis and consider investing !! Thanks for supp.

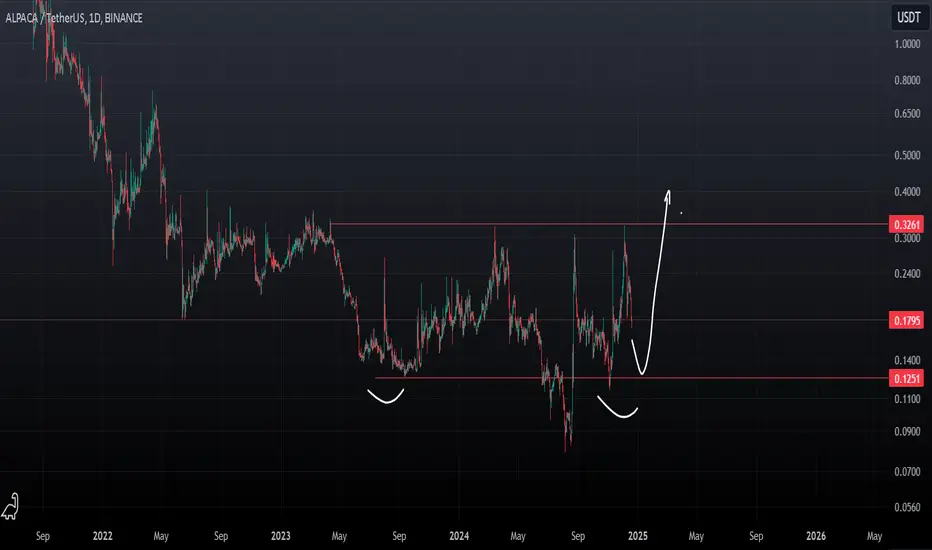
ALPACA Inverse Head and ShoulderALPACA 1D timeframe create iHNS pattern
But if this is not breakout 0.1 i think this scenario is valid
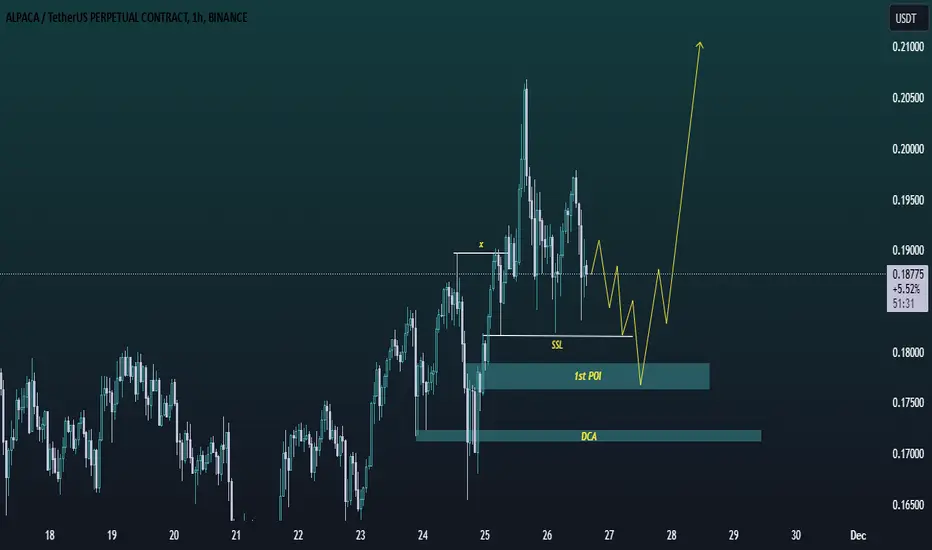
Alpaca 8% profit.AlpacaUsdt was shared yesterday and today it filled our marked entry zone and running in decent profit of 9%.
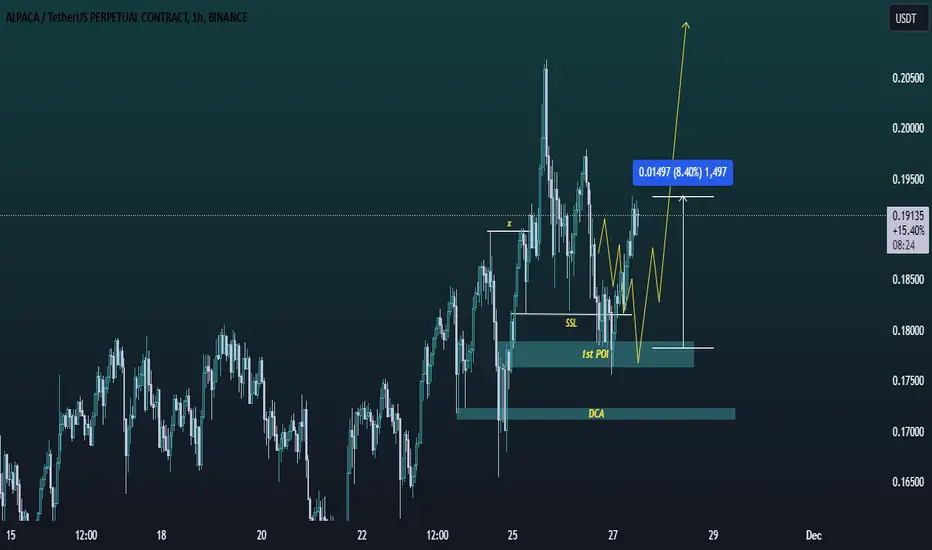
ALPACA/USDT TRADE IDEAALPACA/USDT Poi marked on the chart which is below SSL and DCA marked. Chart says everything, nothing to explain here.
Cant ask for better support in a bullmarketBig breakout trades on alt coins leading to big pullbacks left and right. Price back down to test the breakout level, prior highs, and a whole bunch of moving averages. It's nearly perfect.
This perfectly coincides with the bitcoin moves. Bitcoin consolidates after a large move, Alts pump. Alts sell off as we take profit after a 50% plus move, mostly on leverage around the world so several 100% gains for alot of people. And that profit rotates back into bitcoin to help it break through 90k....and then 100...and then 125 and so on.
This rotation is the epitome of a bullmarket. TAKE NOTE. REVIEW YOUR WINNERS and loser.
And when this is all said and done, simply inverse your chart to see the downside more clearly.

ALPACAUSDTWe can attempt to buy ALPACAUSDT from specified level as it break LH , also bullish divergence occur indicate that it moves upward.
SL , TP mention in chart.


ALPACAUSDT SHORT IDEAalpaca just opened to binance futures. before this it pumped almost %50. generally after opening futures, coins tend to go lower prices because of short suppression. so i will try short setup;
entry : 0.2189
stop : 0.2416
target : around 0.146
its not financal advice.

ALPACAUSDT(AlpacaFinance) Updated till 22-08-24ALPACAUSDT(AlpacaFinance) Daily timeframe range. we can see huge retrace from price discovery level. still lots of space to cover. its trying to get a close over 0.2085, a valid close over that will give it another chance to push. recent support at 0.1566.

Alpaca / UsdtBINANCE:ALPACAUSDT
Alpaca Coin has recently experienced a significant price increase, reaching a current level of $0.1397. This upward movement was met with resistance around the $0.1555 mark, where the price struggled to maintain momentum and eventually faced rejection. This rejection suggests that the $0.1555 zone is a critical level of resistance, where selling pressure has outweighed buying interest.
In terms of support levels, the price currently finds support around $0.1200. If the coin's price falls below this level, it could signal a bearish trend, indicating further potential declines. The next notable support zone below $0.1200 is at $0.1000. This lower support level represents a crucial point where buying interest may re-emerge to prevent further declines.
A break below the $0.1200 support could lead to testing the $0.1000 support area. Traders should closely monitor these levels, as they could provide insights into the coin's potential price trajectory. A failure to hold at these support zones might indicate further bearish momentum, while holding these levels could suggest a consolidation phase or potential rebound.
Disclaimer : I am Not Financial Adviser


Possible Break-out in 4HWith RSI divergence, expecting trend change for Alpaca in 4H timeframe. Before entry, trend break-out must be confirmed.

ALPACA trading a major resistance levelALPACA like many other coins is trying to break the resistance on this time frame.
If nothing goes wrong with the market.. most coin may try to recover to previous ATHs
There is also a probability to get rejected ..considering the current market conditions:
greed and fear index >> very greedy >> very much liquidity from the common investor.
>> a good perspective for a sell-off. Considering the FOMO from the MEME-coins season.
Stay focused!
stay patience
stay in the market (for now)
we all need a Zen mindset to succeed!

ALPACA NEW INCREASE VOLUMEALPACA shows a new increase in volume, which could be confirmed in the coming time frames.
We will follow the coin to see if it's able to confirm.
The reason for the volume is the trend data that this coin shows.
This coin is at basic choice on daily trends.

$ALPACA time will comeSome of the Defi coins are moving like crazy, if the green support holds, ALPACA pump will be huge. Targets are on the chart.


ALPACAUSDT.4HBased on the market data provided, the ALPACA coin is currently trading at $0.1918 against USDT. The 4-hour chart shows a relative strength index (RSI) of 56.89, which suggests that the coin is neither overbought nor oversold. The Moving Average Convergence Divergence (MACD) for the same time frame is 0.0039, indicating a bullish trend. The Bollinger Bands (BB) for the 4-hour chart are at 0.0038, which suggests low volatility.
Looking at the daily chart, the RSI is at 56.03, which also suggests the coin is neither overbought nor oversold. The MACD for the daily chart is 0.003, which indicates a bullish trend. The BB for the daily chart is at 0.2138, which shows low volatility.
The weekly chart shows an RSI of 53.97, which is also in the neutral zone. The MACD for the weekly chart is 0.0018, which indicates a bullish trend. The BB for the weekly chart is at 0.2136, which shows low volatility.
The coin has support levels at $0.1861, $0.1718, and $0.1612 for the 4-hour chart; $0.1897, $0.1708, and $0.1548 for the daily chart; and $0.1711, $0.1461, and $0.1246 for the weekly chart. The resistance levels are at $0.2035, $0.2115, and $0.2295 for the 4-hour chart; $0.2122, $0.2341, and $0.2650 for the daily chart; and $0.2439, $0.2730, and $0.3566 for the weekly chart.
In conclusion, the ALPACA coin is currently in a bullish trend across all three time frames (4-hour, daily, and weekly). However, the volatility is low as indicated by the Bollinger Bands. The coin is also trading in the neutral zone as suggested by the RSI. Therefore, investors should monitor the market closely for any potential breakout from the current trend.
