Multiply Your Bitcoin Strategy ExplainedThis is the easiest Bitcoin multiplication strategy you will ever read. It is truly simple and it only requires patience.
The actions that you need two take will be divided in two, two steps.
One starts now, the second one is several months away.
This is the easiest move/money you will ever make... Follow me!
This is the "Multiple Your Bitcoin Strategy Explained."
👉 Buy low, sell high.
Thank you for reading.
Namaste.
ALPHABTC trade ideas

✳️ Stella 1197 Days Higher Low Can Lead to 1000% or 11X In 2024Up to this point, we have a 1,197 days long higher low. ALPHABTC hit this higher low this same week, 12-February but here is the catch, there can be another drop, lower prices, a lower low. This isn't necessarily what is going to happen but is always a possibility. Once we reach this point in the market cycle, we do not worry about this potential scenario.
➖ A lower low? Buy more.
➖ A lower low? Wait patiently...
The pair is bottomed out, literally, so the risk is very low while we have extreme potential for growth. These are the winning trades long-term. It makes trading so easy... Just spot the opportunity, jump in and let the market take care of the rest.
The rest can be found on the chart.
The red arrow is for illustration only, the waves can develop very differently. Look at the bullish wave between October 2020 and February 2021... Something like this yet not ruling out new All-Time Highs.
Namaste.

Preparing for a new upswing?With the market down, Alpha has had a good fall. It is slowly trying to recover.
First, it had a cup resistance to break and it succeeded. Now it seems to be making a pullback.
I will update completely according to the market and gradually, but my first target is somewhere between 0.00000292 and 0.00000297.
Let's watch and see.
Not investment advice !!!

How to make 140% profit with Alpha in a few daysHello, traders and investors. Today, I want to share with you my analysis on Alpha, a promising asset that can make you a lot of money in a short time.
Stellar is one of the attractive and interesting projects in the field of digital storage space. This project provides the possibility of storing, transferring and retrieving data through a network of independent nodes, with low cost and high security. Stellar also supports smart contracts and has the ability to connect to other networks.
In terms of market, Stellar is currently in a strong upward wave and is expected to reach 28 cents soon. This price is one of the important resistances that has been broken several times in the past. If Stellar can cross this resistance, it can open the way for further growth. Based on my analysis, Stellar can grow 140% and reach 67 cents. This price is one of the targets of the fifth wave of Elliott Wave, which is shown in the chart.
Of course, this analysis is only based on price formation and may change under the influence of external factors and other technical data. Therefore, it is recommended that you always use appropriate stop loss and target profit and manage your risk. Also, before investing, do your own research and make your decisions based on your knowledge and experience.
I hope this analysis is useful for you and I welcome your comments and suggestions. Good luck.

#ALPHA/BTC - Long - Potential 5.55&Direction: Long
Market: Spot
Risk: 0.25% - 1%
#BTC_ALPHA
Exchange: BINANCE
Timeframe: 360
TP1: 0.00000435
Entry: 0.00000414
STOP: 0.00000393
Entry Conditions:
| Broke FastMA
| Long term trendbreak

Alpha Venture DAO (ALPHA) forming bullish BAT for upto 35% pumpHi dear friends, hope you are well and welcome to the new trade setup of Alpha Venture DAO (ALPHA).
On a 4-hr time frame, ALPHA with Bitcoin pair is about to complete a bullish BAT move.
Note: Above idea is for educational purpose only. It is advised to diversify and strictly follow the stop loss, and don't get stuck with trade

Alpha Venture DAO (ALPHA) - Bullish divergenceOn the above 2-day chart price action has corrected 95% since February 2021. A number of reasons now exist to be bullish, including:
1) The ‘incredible buy’ signal
2) The regular bullish divergence. As a matter of fact, 10 oscillators are printing bullish divergence over a 30 day period. Amazing.
3) RSI resistance breakout.
4) This is a ‘What if’ list candidate.
Is it possible price action falls further? For sure.
Is it probable? No.
Ww
Type: trade
Risk: <=6% of portfolio
Timeframe: don’t know.
Return: 10-15x


ALPHA TO OUTPERFORM BITCOINSend Alpha, calling this to outperform BTC this month,
Alpha Finance Lab is a cross-chain DeFi platform that looks to bring alpha to users across a variety of different blockchains, including Binance Smart Chain (BSC) and Ethereum. (Coinmarketcap)

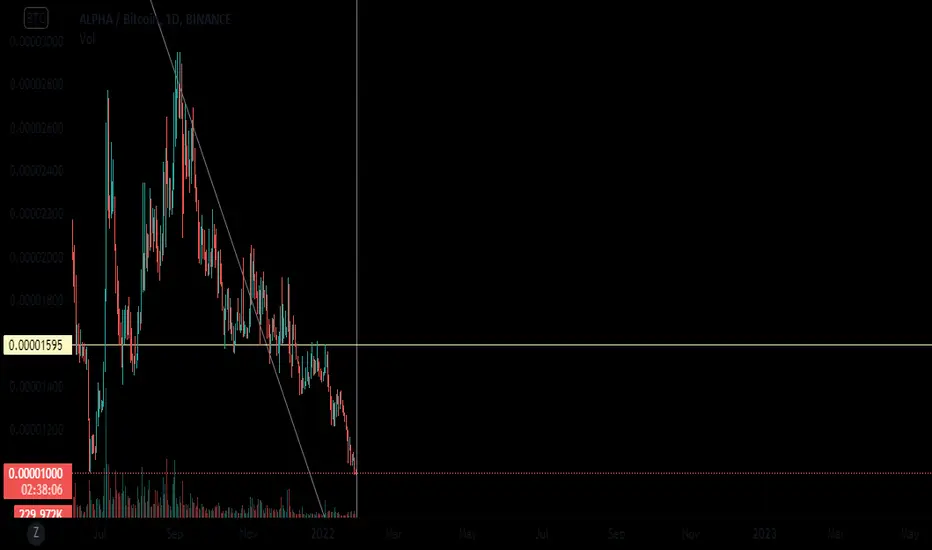
ALPHABTCHello friends, today you can review the technical analysis idea on a 1D linear scale chart for ALPHA
target 1590
stop loss 990
very good
ALPHABTC is testing the weekly support
The price is testing important weekly support after a breakdown from the falling wedge.
As you Know the falling wedge is a reversal pattern, but the price had a breakdown from it. We need to monitor the price action and understand if it was a real breakdown or a false one.
Usually, We avoid opening a short position on the weekly support, for that reason, we are waiting for a reversal.
How to approach?
If the price is going to have a breakout from the daily resistance and retest as new support, we can add to our watchlist and wait for applying our rules for a new long position.
Otherwise:
If the price is going to lose the support and retest as new resistance, we will wait for applying our rules for a new short position.
–––––
Follow the Shrimp 🦐
Keep in mind.
🟣 Purple structure -> Monthly structure.
🔴 Red structure -> Weekly structure.
🔵 Blue structure -> Daily structure.
🟡 Yellow structure -> 4h structure.


Alpha Finance mainnet coming, Might pumpKeyword of importance is might, I never trade such slow coins but it can pump this time. Why? TA much imporessive? Absolutely no.
But they do have a mainnet event coming this 8th December
Buy the hype, sell the news.
WAGMI
-Nav

ALPHA is ready to the MOON?ALPHA is a Defi coin and it is ready to take off... this is not financial advice...

ALPHABTCALPHA has formed a good upward pattern and could start a bullish movement. Targets are shown in the chart.


AlphabtcHi. We see alpha is in decending wedge. And now we see breakup done and we take profit with 200% potential.

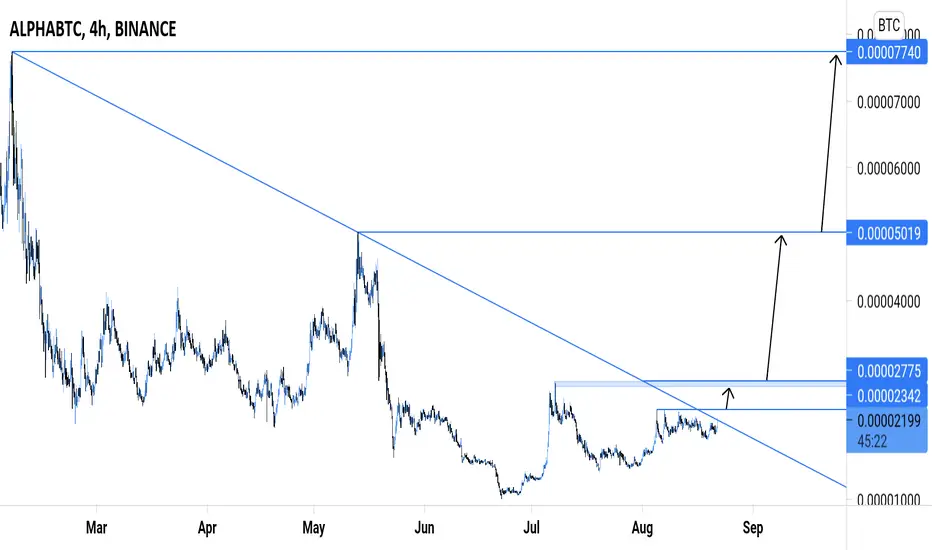
ALPHA/BTC { ALPHA FINANCE LAB } - BULLISH SETUPANALYSIS 🔎
- ALPHA/BTC was resisted by the descending trendline resistance.
- Price brokeout above the descending trendline resistance.
- This is a bullish signal.
BUY ENTRY ⬆️
- Market entry: current market price.
- Limit entry: possible retest.
- Stop limit: breakout above the horizontal resistance level (@0.00002342).
TARGETS 🎯
- Horizontal resistance level (@0.00002775).
- Horizontal resistance level (@0.00005019).
- Horizontal resistance level (@0.00007740).
SETUP INVALIDATION ❌
- Breakdown below the previous swing low support level.
Alpha Comprehensive AnalysisI see a static resistance around 2230 satoshi which is tested and then denied about 7 times lately. In theory I assume that resistance is finally broken so what is the target? A giant dynamic resistance has been formed since day One of alpha(The great gray line). Price has been playing below that grey line for about 90 days. That is a strong and serious line which may cause a delay on price growth. Now Price around that line is around 2800 satoshi.
Above is another trendline which has been formed since the local top around Mid-May.Now Price around that line is around 3000 satoshi. That is a focal point which may let price grow through last top area (7k satoshi).
So There is a road to ride for Alpha and there is a safer way with fundamentals. Team has released many great news about a product called Alpha X. I personally think if price tend to break aforementioned lines, it absolutely needs driving fundamentals like Alpha X( In case of a great product). Below I highlighted a Fibo channel which shows good points to take profits.

$alpha ready for breakout Alpha/btc looking good with this simetric triangle if its break upward we can see big movement upwards

$ALPHA,~30% on the daily ...$ALPHA
~30% on the daily , showing increasing volume as its facing ~2300 sats resistance
From here, looking for a breakout/flip over this level as continuation..
UCTS took the entry at 12H Buy (usually strong) and ~25% up so far..
Let it run
#ALPHA

Alpha X is coming.Hello again.
I jumped into a great project with lots of products. Let's get to TA directly .
I see 2x dynamic resistance that we need to breakup and a great support that holds price at 2231 sats. Watch out for any upward or downward breakout so you can trade that. $ALPHA
