ALPHABTC trade ideas


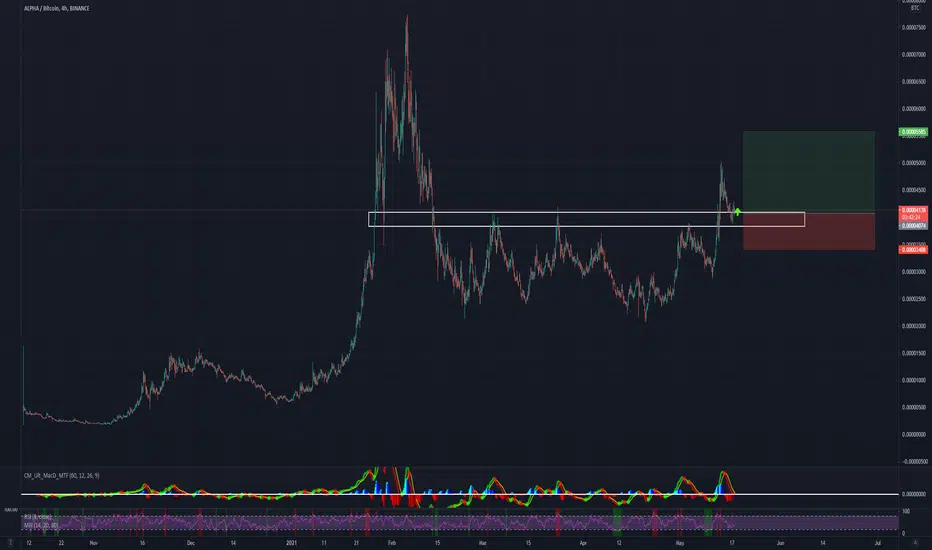


Alpha is about to breakout the Channelas its shown in the chart, BINANCE:ALPHABTC is trading in a side channel and now it is about to break the channel upwardly. so wait for breakout and confirmation and then open your position accordingly.
in case of breakout, targets are 4600 and 5200 sats.
happy hunting!

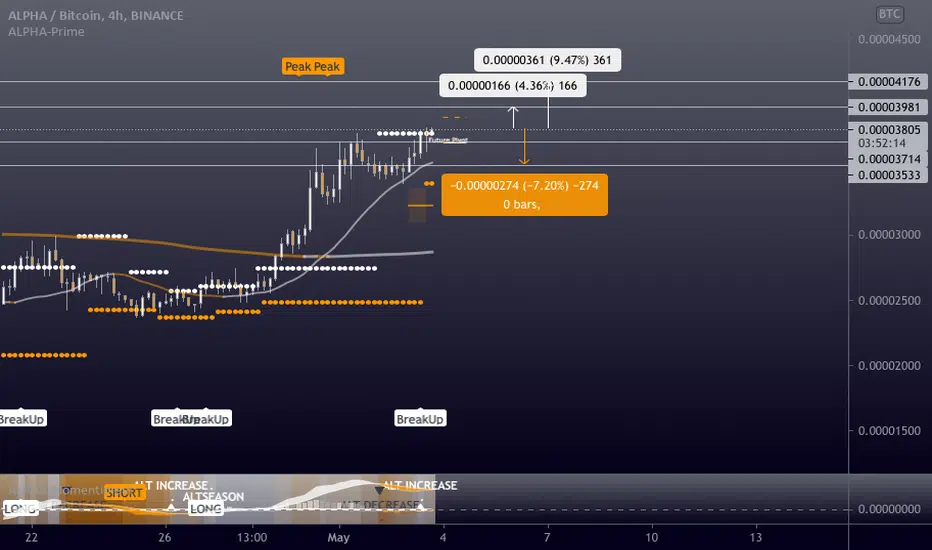
ALPHABTC - Long - Potential 9.47%ALPHABTC - Long - Potential 9.47%
Exchanges: Binance
Signal Type: Regular (Long)
Entry Zone:
0.00003714 - 0.00003805
Take-Profit Targets:
1) 0.00003981
2) 0.00004176
Stop Targets:
1) 0.00003533
Trailing Configuration:
Entry: Percentage (0.0%)
$ALPHA, Flashing a 1D UCTS Buy (needs to close this way..)$ALPHA
Flashing a 1D UCTS Buy (needs to close this way..)
Volume slowly rising and overall market is starting to look bullish AF
embrace those that are lagging behind 🍀🤞
#ALPHA


ALPHA/BTCLook like ALPHA has found the bottom in btc pair. Bullish divergences have started forming on the lower timeframe. With the bullishness of the market right now, it seems to be an obvious play.
BUY it !!!
Note: If you like the content and the setup, please give me a follow not to miss out on many altcoins charts to come.

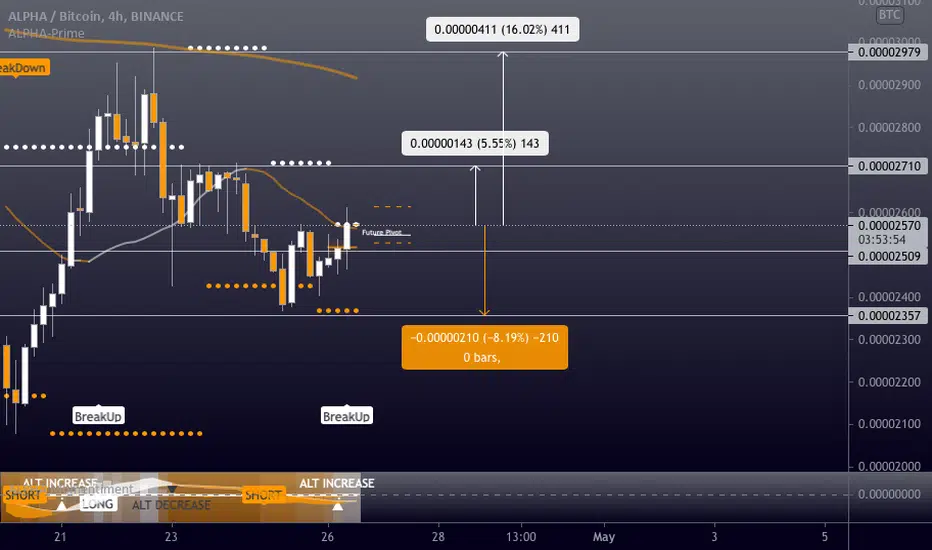
ALPHABTC - Long - Potential 16.02%ALPHABTC - Long - Potential 16.02%
Exchanges: Binance
Signal Type: Regular (Long)
Entry Zone:
0.00002509 - 0.00002568
Take-Profit Targets:
1) 0.00002710
2) 0.00002979
Stop Targets:
1) 0.00002357
Trailing Configuration:
Entry: Percentage (0.0%)
Crypto|ALPHA/BTC|LongLong ALPHA/BTC
Activation of the transaction only when the blue zone is fixed/broken.
The author recommends the use of anchoring fixed the blue zone, this variation is less risky.
If there is increased volatility in the market and the price is held for more than 2-3 minutes behind the activation zone after the breakdown, then the activation of the idea occurs at the prices behind the activation zone.
The idea is to work out the resistance level .
* Possible closing of a trade before reaching the take/stop zone. The author can close the deal for subjective reasons, this does not completely cancel the idea and is not a call to the same action, you can continue working out the idea according to your data, but without the support of the author.
+ Maybe right now we will go even lower, then it's okay, the idea is not activated and simply canceled.
+ ! - zone highlighted by the ellipse is a zone of increased resistance, in this area there is a possible reversal for a correction, please take this factor into account in this transaction.
The "forecast" tool is used for more noticeable display of % (for the place of the usual % scale) of the price change, I do not put the date and time of the transaction, only %.
Blue zones - activation zones, 2 activation zones are indicated ( A1 and A2).
Green zones - take zones.
Red zone - stop zone, 2 stop zones are indicated (A1- "L-SL1", A2-"L-SL2").
Working out the stop when the price returns to the level after activation + fixing in the red zone.
Orange arrow - the direction of take.
The red arrow - the direction of the stop.
SUM PNL: This parameter displays the total % of all closed ideas of the "new" format (according to the author) for this sector at the time of publication of the idea. The calculation is very "clumsy" just the sum of the profits of all the ideas, based on this indicator, you can more accurately assess the risks when working with my ideas of this sector. I present you the construction of the idea, you can use it yourself as you like based on your subjective view and risks, the calculation of the PNL indicator is carried out only on transactions that the author closed on TV in manual mode or by take.
P.S Please use RM (risk management) and MM (money management) if you decide to use my ideas, there will always be unprofitable ideas, this will definitely happen, the goal of the system is that there will be more profitable ideas at a distance.

one of the biggest projects in crypto market Alpha is going to hit all these targets inshallah ... just be patient

AlphabtcUpdate previous idea.Note that most analyzes can change with bit movement conditions, especially when bit loss. So always have a look at the bit movement.


ALPHABTC (17.04.2021)The ALPHA price found support at 76.4% Fibonacci at 1D, which generated a possible local momentum to start growing.
In turn, on H4, the price has overcome the downward trend and is ready to continue growing.
We recommend buying a coin with a stop loss at the local minimum of 0.000022 and a target profit level of 0.00005-0.000065

Crypto|ALPHA/BTC|LongLong ALPHA/BTC
Activation of the transaction only when the blue zone is fixed/broken.
The author recommends the use of anchoring fixed the blue zone, this variation is less risky.
If there is increased volatility in the market and the price is held for more than 2-3 minutes behind the activation zone after the breakdown, then the activation of the idea occurs at the prices behind the activation zone.
The idea is to work out the resistance level .
* Possible closing of a trade before reaching the take/stop zone. The author can close the deal for subjective reasons, this does not completely cancel the idea and is not a call to the same action, you can continue working out the idea according to your data, but without the support of the author.
+ Maybe right now we will go even lower, then it's okay, the idea is not activated and simply canceled.
+ ! - zone highlighted by the ellipse is a zone of increased resistance, in this area there is a possible reversal for a correction, please take this factor into account in this transaction.
The "forecast" tool is used for more noticeable display of % (for the place of the usual % scale) of the price change, I do not put the date and time of the transaction, only %.
Blue zones - activation zones, 2 activation zones are indicated ( A1-at the exit from the support zone and A2-at the support).
Green zones - take zones.
Red zone - stop zone, 2 stop zones are indicated (A1- "L-SL1", A2-"L-SL2").
Working out the stop when the price returns to the level after activation + fixing in the red zone.
Orange arrow - the direction of take.
The red arrow - the direction of the stop.
SUM PNL: This parameter displays the total % of all closed ideas of the "new" format (according to the author) for this sector at the time of publication of the idea. The calculation is very "clumsy" just the sum of the profits of all the ideas, based on this indicator, you can more accurately assess the risks when working with my ideas of this sector. I present you the construction of the idea, you can use it yourself as you like based on your subjective view and risks, the calculation of the PNL indicator is carried out only on transactions that the author closed on TV in manual mode or by take.
P.S Please use RM (risk management) and MM (money management) if you decide to use my ideas, there will always be unprofitable ideas, this will definitely happen, the goal of the system is that there will be more profitable ideas at a distance.


Alpha now or neverGreat potential for ALPHA/BTC at the current prices. Keeping in mind the market momentum and the solid project behind Alpha Finance Lab its a bet to take in consideration :)

