Hello previous All-time-low price of 0.02 centsI have been following this bearish triangle on ALPHA for a while and have entered a short position at the breakout.
My current view for this shitcoin is that the minimum target we should see is 0.0623, and if the bearish momentum is strong enough, we can sufficiently see it go to 4 - 3 - 2 cents range.
ALPHAUSDT trade ideas

APLHA USDT PERP Hello Trader OKX:ALPHAUSDT.P
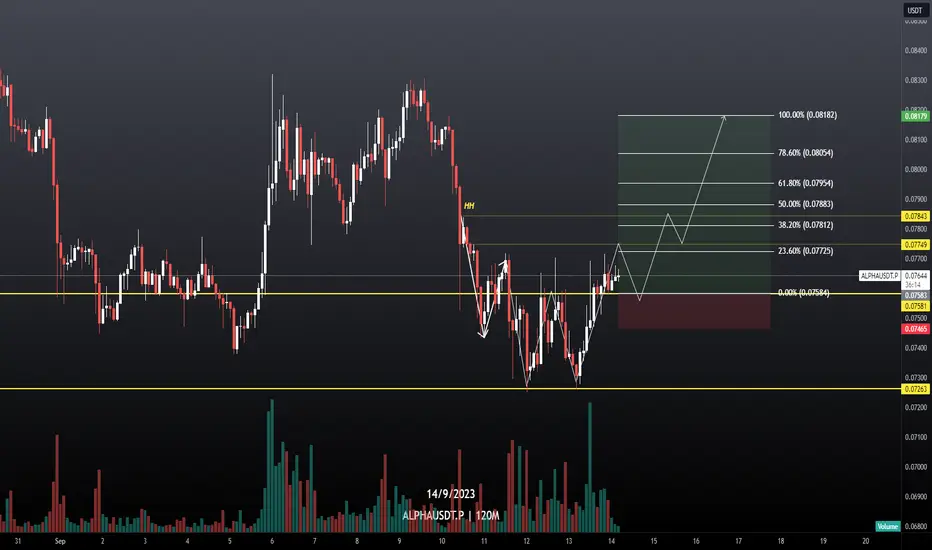
indication of a double bottom after a long bearish. can be a benchmark for long in the spot area and buy in futures.
entry point has been determined
Please add a comment and Positive feedback and
constructive criticism are important to authors and the
community.
Disclamer: Not Financial Advice
all leverage 20X
ALPHA USDT PERP Hello Trader OKX:ALPHAUSDT.P
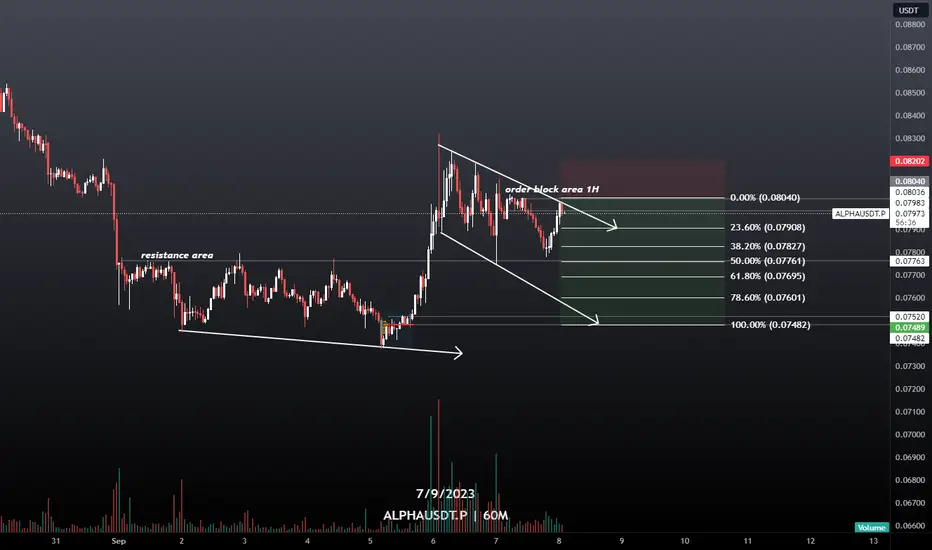
I took the nearest resistance area for the sell area because the nearest sell area is there.
Please add a comment and Positive feedback and
constructive criticism are important to authors and the
community.
Disclamer: Not Financial Advice
all leverage 20X

ALPHA USDT PERP Hello Trader OKX:ALPHAUSDT.P
the resistance area bounced in a bullish direction. but for block orders the immediate area experienced a fairly deep reject for the long term because the usdt experienced strengthening.
Please add a comment and Positive feedback and
constructive criticism are important to authors and the
community.
Disclamer: Not Financial Advice
all leverage 20X
ALPHA USDT PERP Hello Trader OKX:ALPHAUSDT.P
the entry area is a bit tricky / big risk. because you miss the moment. so be sure to take the nearest support for the benchmark buy area.
Please add a comment and Positive feedback and
constructive criticism are important to authors and the
community.
Disclamer: Not Financial Advice
all leverage 20X

ALPHA UPDATEALPHA pumped after Falling Wedge Breakout with Double Bottom confirmation, need to break this strong resistance zone for uptrend continuation

ALPHAUSDTALPHAUSDT was respecting the falling trendline but recently it break the trendline along with bullish divergence. Currently the instrument is making support zone but it seems like it is getting ready for some serious bullish momentum.

ALPHAUSDTNot an investment recommendation. This chart was made for personal study and personal use only. If you liked the idea, please like it. If not, write why. In my humble opinion, the price will go up.

THE KING OF THE HEAD AND SHOULDERS | How to find this pattern
⚡Zer0_Trader
The essence of the strategy is to search for the direct and inverted "Head & Shoulders" pattern
Shoulders" pattern with the simultaneous confirmation of its potential workout on
Zer0 Trader Indicator" indicator, which makes it possible to trade regularly,
minimizing the closing of trades by stops.
❌TRADING WITHOUT AN INDICATOR
We see the "Head & Shoulders" formation, enter the trade 🔜 the trade is closed by a Stop Loss⛔
✅Trading with the "Zer0 Trader Indicator" indicator
We see the formation "GIP", we see the confirmation of the result on the indicator, we go into
trade 🔜 trade is closed at Take Profit
As you can see from the examples above, it is absolutely not enough to find
only a formation because:
- Perfect formations are quite rare in the market, and full-fledged
it is necessary to trade regularly to make a full-fledged profit;
- Every trader tends to see or "complete" a formation where it is not
any trader has a tendency to see or "draw" a formation where it doesn't exist and this leads to an increase in loss-making trades;
- without additional confirmation of a potential working out of a formation your deals
form, your trades will be closed by stops more often and take unnecessary losses which
you could have avoided using the indicator.
📈 INDICATOR "Zer0 Trader Indicator"
In order to enter non-obvious but potentially profitable situations and
I created the "Zer0 Trader Indicator" indicator to minimize errors. Thanks to
which increased the percentage of profitable trades by 90%, and the percentage of trades closed
of trades closed by stop was reduced to 10%.
The signal to enter the trade, along with the formation of Head & Shoulders/reverse Head & Shoulders, are the reduction of
strength on the indicator, namely, descending peaks (divergence/convergence), as in the
examples below.
🔎EXAMPLES OF WORKOUTS
In the framework of the trading strategy with the use of the indicator all situations can be
can be divided into 2 types:
- Head & Shoulders/ reverse Head & Shoulders with a flat base
- Head & Shoulders/ reverse Head & Shoulders with diagonal base
🟢Head & Shoulders/ reverse Head & Shoulders with flat base
*ideal, but rather rare situation
🟢Head & Shoulders/ reverse Head & Shoulders with a diagonal base
*The situation you will deal with most often
✍️ STEP BY STEP INSTRUCTIONS FOR WORK
Setting up a chart in TradingView
- Line" chart view
- logarithmic scale
Searching for the Head & Shoulders/ reverse Head & Shoulders pattern
- it is important that similar patterns draw several coins simultaneously
- on a downtrend, the chart and the indicator should be reversed (the scale should be inverted)
- you can look for a pattern by the indicator (divergence)
- the more ideal-looking is the pattern, the higher is the probability of its execution
- it is important that the pattern is drawn correctly not only on the line, but also on a candlestick chart
chart
Comparison of the chart and the indicator
The indicator must show a decrease in strength (three
divergence).
Searching for the entry point
TVX - entry point when the neckline is broken and the
of the candle behind it. It's important to have an identical pattern
on other coins as well.
Risk evaluation
Potential of the trade is measured from the top of the head to
the level of the neck line. We draw a line from the peak of the head to the
the neck line and re-position it to the potential breakout point.
We take the "Short/Long Position" tool and put
it in the TVX. Then we stretch out the targets by the level of potential,
and stop 3-4% above the head (on the candlestick chart).
Setting targets
Objective 1 (45%) - from the entry point to the middle of the breakout
Target 2 (45%) - till the end of analysis
Target 3 (10%) - to the moon, based on the previous extremums
*At achievement of the first target we move the stop to the Buy
☢️ THE MOST COMMON MISTAKE
Entering a trade in the absence of a pronounced divergence on the indicator
Such an error leads, at a minimum, to unjustified and useless losses, and, at a maximum, to
at most, liquidation, if there were no stops at all!
🔴THE MOST IMPORTANT SECTION
WHERE TO START TRADING?
You have read this tutorial, you understand everything and you are ready to fix the profit. BUT!
The first thing you need to start with is training on history and developing
observation of not just the chart, but the chart through the prism of this strategy. For
I strongly recommend each of you to do your homework.
Despite the fact that I've been trading for several years now, I myself regularly
myself on a regular basis.
HOW TO DO MY HOMEWORK?
1. You pick any coin and any year that has already completely passed.
2. Rewind the chart to January 1 and press "Market Simulator", which
will hide the chart movement from you after that date.
3. Choose a simulation speed of x10 and press the "Forward" button until you see the potential formation of the right shoulder,
until you see the potential formation of the right shoulder and head.
4. Next, you draw a potential neck line, a working pattern, and wait for
for confirmation of the formation. Additionally, see if a similar situation is drawn on other charts.
situation on other charts.
5. The deal worked out.
6. Make 2 screenshots (line + candlestick) and enter the results in the table
"Home" in your worksheet.
7. You save the screenshots in the folder with the name of the coin and drop them into the chat room, where I will
give comments.

ALPHA CAN PUMP HARDLYHi, dear traders. how are you ? Today we have a viewpoint to BUY/LONG the ALPHA symbol.
For risk management, please don't forget stop loss and capital management
When we reach the first target, save some profit and then change the stop to entry
Comment if you have any questions
Thank You

alphaNow, in my opinion, it is in a tight resistance zone, which if it crosses, it can see the high numbers
And if it is not possible, we will think about an entry point in those green lines

ALPHA LOOKS BULLISHHi, dear traders. how are you ? Today we have a viewpoint to BUY/LONG the ALPHA symbol.
For risk management, please don't forget stop loss and capital management
When we reach the first target, save some profit and then change the stop to entry
Comment if you have any questions
Thank You

Range zone will be over do you think its a good time to open a long position on ALPHAUSDT ?
i think so
so tell me what do you think!
The information provided on this Page does not constitute investment advice, financial advice, trading advice, or any other sort of advice and you should not treat any of the website's content as such. this page does not recommend that any cryptocurrency should be bought, sold, or held by you. Do conduct your own due diligence and consult your financial advisor before making any investment decisio

alpha Getting ready for Recovery towards 1$Seems Like Getting Ready for recovery towards 1$
Formed Descending Channel & Inverted Heads & Shoulders In 2 Days Timeframe
Once Both Got Cleared Recovery Will Be Epic Expecting Move Towards 1$ Incase Of Breakout

ALPHAUSDTALPHAUSDT is in trend reversal mode divergende shown in RSI which indicates that potentially trend is going to reverse

Alpha USDT Long Entry Chats shows a bullish signBINANCE:ALPHAUSDT.P Alpha USDT
Price Break the resistance level .11276 now retest the in 1 Hr TF. Bullish Candle in 4 Hr very good bullish sign towards price more upward direction in coming hr. Price 2 times test the .12544 Level now again test this level. If price break this level or stay above this level at least 1 day then chances move upward direction. Otherwise again tested and rejected this level again.
Now we enter the .11500 level. And tp is .12511.

Alpha testing longI am testing a modified script for trading on short and long-term segments, do not open positions without your own TA, stoploss is only indicative
Real signal is on 5min chart, so it is just for testing

Miracles Happen - ALPHA USDTOG DeFi Play ALPHA has had some stick recently trying to get some funds back from a partner but prices is still showing some decent wicks up which appear to be getting sold as it comes inclose to the long down trend line will price action push above for a miracle breakout?
Showing some bearish divergence which doesn't bode well for potential upside but at the same time printing higher highs and higher lows which is positive.
Can see a potential inverse head and shoulders pattern forming as well.
There is also a bullish wedge forming.
Finally the cloud is showing massive resistance, but if we get a strong breakout and a close in the cloud it could be action time for ALPHA for an edge to edge trade of the ichimoku cloud.
Some good R:R if we breakout, I will be watching closely but expecting nothing.
Peace. NFVeeJ.


ALPHA/USDT WCA - Inverted Head and Shoulders PatternHello and thank you for taking the time to read my post. Today, we analyze the ALPHA/USDT chart on the weekly scale, focusing on a classic price pattern called the "Inverted Head and Shoulders Pattern."
Inverted Head and Shoulders Pattern:
The inverted head and shoulders pattern is a bullish reversal pattern that occurs at the end of a downtrend. It is characterized by three troughs or valleys, with the middle one being the lowest (the head) and the two on either side being relatively higher (the shoulders). The pattern is completed by a horizontal line called the "neckline," which connects the highs of the shoulders. In a nutshell, the formation of the inverted head and shoulders pattern signals a potential reversal from a downtrend to an uptrend.
Remember, this is just a brief introduction to the technical aspects of the inverted head and shoulders pattern. As you delve deeper into this topic, you'll discover more nuances and practical applications that can enhance your trading strategies.
Additional Analysis:
As we carefully study the ALPHA/USDT weekly chart (Binance), a diagonal resistance line (blue) emerges, which began on 01/02/2021 and has been acting as a staunch barrier ever since. Another key observation is the 50 EMA still displaying its resistance role, indicating that we should focus on observing rather than trading. The neckline, a vital element of this pattern, has formed in the price area of 0.1831 and is now 350 days old, which corresponds to 11.5 months. This insight is crucial as the longer a price pattern consolidates, the more forceful the breakout will be when it eventually occurs.
The near-perfect symmetry between the shoulders adds an artistic touch to the pattern, and we can also observe positive momentum in the form of a bullish engulfing above the symmetry line. For intrepid traders, this could represent an early entry opportunity, with the stop-loss positioned at the symmetry line. However, we advocate waiting for a breakout above the neckline, as the resistance is undoubtedly formidable. In this case, patience is truly a virtue. Thus, this pattern is more suited as a watchlist candidate than an active trade to enter at this time.
Conclusion:
The ALPHA/USDT weekly chart showcases an Inverted Head and Shoulders Pattern, reflecting a potential reversal from a downtrend to an uptrend. By closely monitoring the pattern's intricacies and the market's subtle cues, traders can be better prepared for any potential price action in the future. As always, it's essential to consider risk management and proper position sizing when trading based on chart patterns.
Please note that this analysis is not financial advice. Always do your own due diligence when investing or trading.
If you found this analysis helpful, please like, share, and follow for more updates. Happy trading!
Best regards,
Karim Subhieh

ALPHA CAN GO UP AGAINHi, dear traders. how are you ? Today we have a viewpoint to BUY/LONG the ALPHA symbol.
For risk management, please don't forget stop loss and capital management
When we reach the first target, save some profit and then change the stop to entry
Comment if you have any questions
Thank You

ALPHA! be wild in the next few monthssitting at the lower band of the pitchfork. expecting to touch the upper band. Low marketcap, expect a wild pump in the next few weeks

ALPHA : CHART VIEWInteresting to follow ALPHA to see if it's able to gain the 10-18% range for the day trading in the coming time.
The trend should have first a time frame confirmation before it can gain.
