ALT/USDT - Parabolic moveis preparing for its next parabolic move. Over the past 10 days, price has established a solid base support around the $0.033 zone, consolidating in a tight range. This accumulation structure suggests that a breakout and strong upward leg could be imminent.
Related pairs
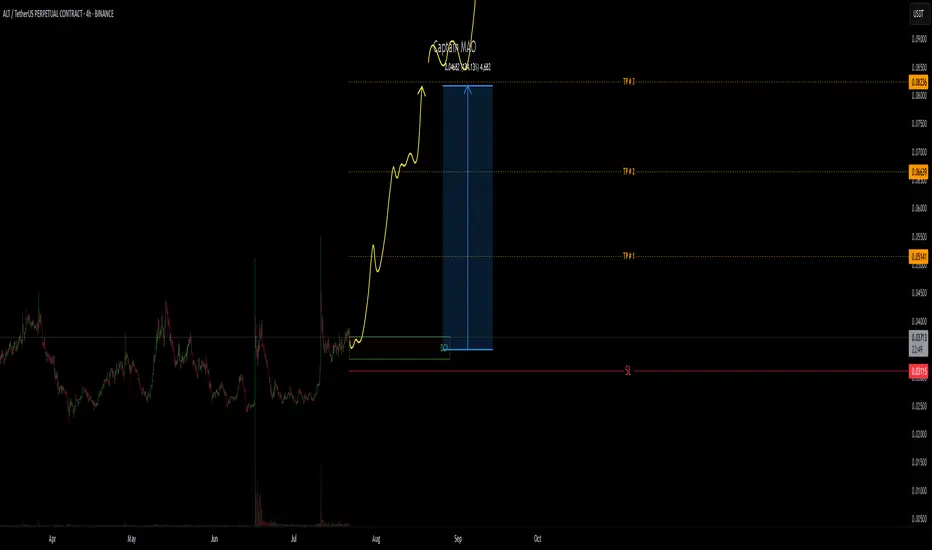
ALT- Trading idea.
Altlayer - emerges as a decentralized protocol designed to revolutionize the blockchain landscape by simplifying the launch of native and restaked rollups. These rollups, which can be based on optimistic or zk-rollup stacks, benefit from enhanced security, decentralization, and interoperability

ALTUSDT Forming Potential BreakoutALTUSDT is shaping up to be an interesting opportunity for crypto traders watching for potential breakout plays. The pair has recently tested a strong horizontal support zone multiple times, forming a solid base around that level. This accumulation range is a key area where buyers seem to step in ag

ALT/USDT +200%ALT recently delivered a powerful +100% pump, showcasing the strength of the $0.024 – $0.025 demand zone. After a healthy 50% retracement from the previous leg up, price action is now stabilizing and forming a new support base around the $0.025 – $0.026 zone — a classic setup for the next major move

ALTUSDT Forming Falling WedgeALTUSDT has recently completed a breakout from a well-formed falling wedge pattern, a strong bullish technical signal that often precedes significant upward momentum. The wedge breakout is backed by a noticeable spike in trading volume, adding credibility to the move and indicating growing market pa

Altcoins Market Bull Market Confirmed, AltLayerThis is just one, another one, but this theme will continue to repeat over and over, again and again.
Here AltLayer is producing a three digits strong bullish breakout; the highest volume ever today and this confirms the start of the 2025 altcoins market bull market.
Total growth amounts to more t

Alt rivers and jump in terminal mood pattern Daily chart Finishing a terminal fractal While the downtrend is expansive The flat waves and patterns promise a near 100% uptrend The 4-hour chart is completing a flat terminal pattern According to the pattern, it could overshadow today's price from tomorrow and continue to grow until the price targ

$ALT Breaks 136-Day Resistance — Big Rally Loading?#ALT has officially broken above the 136-day-long resistance.
Price is now consolidating above the breakout zone, showing strength.
If momentum continues, a major rally could be ahead.
Watching closely for confirmation of the next move.
NASDAQ:ALT BINANCE:ALTUSDT

ALTUSDT 1D AnalysisALT ~ 1D Analysis
#ALT This trade is very risky NASDAQ:ALT Trying to penetrate this resistant line, Buy if successfully penetrate this resistant line with a large volume to avoid false breakout.

Turn off the fear and thinkLook closely: on the left is ALTLAYER, essentially a gem of the current cycle; on the right is HARMONY, a gem of the previous cycle. What unites them? They’re united by a 96% dump. But what happened next? Harmony, from the COVID wick, did a 300x. Now, let’s think: if we cut that 300x down to 100x, i

See all ideas
Summarizing what the indicators are suggesting.
Oscillators
Neutral
SellBuy
Strong sellStrong buy
Strong sellSellNeutralBuyStrong buy
Oscillators
Neutral
SellBuy
Strong sellStrong buy
Strong sellSellNeutralBuyStrong buy
Summary
Neutral
SellBuy
Strong sellStrong buy
Strong sellSellNeutralBuyStrong buy
Summary
Neutral
SellBuy
Strong sellStrong buy
Strong sellSellNeutralBuyStrong buy
Summary
Neutral
SellBuy
Strong sellStrong buy
Strong sellSellNeutralBuyStrong buy
Moving Averages
Neutral
SellBuy
Strong sellStrong buy
Strong sellSellNeutralBuyStrong buy
Moving Averages
Neutral
SellBuy
Strong sellStrong buy
Strong sellSellNeutralBuyStrong buy
Displays a symbol's price movements over previous years to identify recurring trends.
Frequently Asked Questions
The current price of ALT / TetherUS (ALT) is 0.03979 USDT — it has risen 7.89% in the past 24 hours. Try placing this info into the context by checking out what coins are also gaining and losing at the moment and seeing ALT price chart.
ALT / TetherUS price has risen by 2.33% over the last week, its month performance shows a 45.17% increase, and as for the last year, ALT / TetherUS has decreased by −71.23%. See more dynamics on ALT price chart.
Keep track of coins' changes with our Crypto Coins Heatmap.
Keep track of coins' changes with our Crypto Coins Heatmap.
ALT / TetherUS (ALT) reached its highest price on Mar 27, 2024 — it amounted to 0.69500 USDT. Find more insights on the ALT price chart.
See the list of crypto gainers and choose what best fits your strategy.
See the list of crypto gainers and choose what best fits your strategy.
ALT / TetherUS (ALT) reached the lowest price of 0.00600 USDT on Jan 25, 2024. View more ALT / TetherUS dynamics on the price chart.
See the list of crypto losers to find unexpected opportunities.
See the list of crypto losers to find unexpected opportunities.
The safest choice when buying ALT is to go to a well-known crypto exchange. Some of the popular names are Binance, Coinbase, Kraken. But you'll have to find a reliable broker and create an account first. You can trade ALT right from TradingView charts — just choose a broker and connect to your account.
Crypto markets are famous for their volatility, so one should study all the available stats before adding crypto assets to their portfolio. Very often it's technical analysis that comes in handy. We prepared technical ratings for ALT / TetherUS (ALT): today its technical analysis shows the buy signal, and according to the 1 week rating ALT shows the buy signal. And you'd better dig deeper and study 1 month rating too — it's neutral. Find inspiration in ALT / TetherUS trading ideas and keep track of what's moving crypto markets with our crypto news feed.
ALT / TetherUS (ALT) is just as reliable as any other crypto asset — this corner of the world market is highly volatile. Today, for instance, ALT / TetherUS is estimated as 21.44% volatile. The only thing it means is that you must prepare and examine all available information before making a decision. And if you're not sure about ALT / TetherUS, you can find more inspiration in our curated watchlists.
You can discuss ALT / TetherUS (ALT) with other users in our public chats, Minds or in the comments to Ideas.