AMBBTC trade ideas

AMBBTC - Long - Potential 37.58%AMBBTC - Long - Potential 37.58%
Entry- 149
TP1- 157
TP2- 166
TP3- 205
SL- 136
Happy Trading! Like & Follow if you Agree!


AMBBTCFORMATION OF INVERTED H & D IN 4HRS
FORMATION OF FALLING WEDGE IN 1 DAY
BREAKING OF 0.00000170


AMB/BTC (ambrosus) I went in this Risky long now with the 3 TP indicated in red.
in case of total apocalipse, the next support are signaled in green.

AMB/BTC just for fun "Moon Analysis"AMB/BTC has been in a bear trend for years now
and flipping the top black diagonal whilst creating another
higher low would be bullish.
With the rumors of this supply chain meets blockchain
tech company working alongside IBM, Maersk
and others potentially coming to fruition, it could
see exponential growth...moon targets all the way to nearly
10,000 sats.
The monthly volume of July and August was remarkable,
each being much greater than any month prior. Could this
be wash trading? Maybe, maybe not. But it's fun to look at
moon targets regardless, and if the volume profile is
legitimate as well as the partnerships being true, with
more bullish information released about $AMB we may be
in for an exciting show.
These targets are solely based on previous S/R and
volume, they could very well never come close to
being reached, but with the uncertainty about this
Bitmex situation it's nice to keep things a little
lighthearted.
(S/R horizontal lines drawn on 1W chart,
using monthly candles here to emphasize volume)

AMB-BTC 100-500%Greetings, a very interesting coin that makes money.
The previous idea for this tool is +250% if you count a complex percentage of about 400% with reasonable work from the levels.
At the moment the price has tested support for 150 sat.
The local entry point may be a breakthrough of the trend (orange), the main movement I expect when breaking the trend of the main trend (red), and fixation above the horizontal level of 300, which will mean the final trend reversal. Horizontal level 150 and critical level blue trend support are supported. In this case, the targets are very optimistic 565-800-1100 Sat around 500%. You should not focus on the exact price of the levels, but on the +/- 5% zone, and take it into account when placing orders.
This is not a signal to buy, but information for observation. Always evaluate your risks and place a stop loss.
If you liked the idea, support it with likes.

AMB / BTC 4 hour short edit:AMB, higher on RSI, volume running out and big descending triangle! AMB looks ready for a breakout!
Keep an eye on AMB!

AMB/BTC (Testing Major Support Area)💎Technical Analysis Summary💎
BINANCE: AMBBTC
-Ambrosus is testing major support area at mid 150s sat
-This zone is a confluence of previous support and resistance
-It is also crucial for AMB, because if this failed
-The next potential strong support is way down to 100-90 sat
-So please, if you are planning to open Buy orders
-Make sure you have a proper stop loss in place
-But if you want to play the breakout style
-Wait for the trendline resistance invalidation
-Upside target is up to 200 sat or higher
``````````````````````````````````````````````
Trading Involves High Risk
Not Financial Advice
Please Exercise Risk Management
``````````````````````````````````````````````
If You Like My Daily Published Ideas
A little Help By Supporting My Channel
Through Leaving A Thumbs Up, Comment & Follow
Happy Trading! --> Thank You! :)
``````````````````````````````````````````````


AMB / BTC Still trending downAMB follow the rest of the market. It is hard to predict bullish or bearish out breaks now. But i still holding on to my meaning that AMB are still in a down trend.
When AMB make a daily close abowe the green trend line. Than i will first start to think bullish again to be honest. Remember one thing guys. No one know where the exact bottom or top are. So to DCA in at the prices we see now are not a dumb move.
My charts and ideas are never financial davice. Wish you all the best of luck ,)


AMBBTC - Long - Potential 13.79%AMBBTC - Long - Potential 13.79%
Enter - 174
TP1- 184
TP2- 198
SL- 151
Happy Trading! AMB looking to breakout following the BTC pump!


AMB / BTC still in a down trendTo be honest long term i am bullish on AMB. But still trending down on the daily chart. My trendline show a clear rejection and forming a double top. Double tops to me are signs of weakness. Most likely will we se lower targets before trying to break out again.
This are not a financial advice just my personal opinion.

$AMB Cup and Handle 4H $AMB is 99% from ATH following their new deal with IBM, we can expect a nice pump!

AMB is ready to get five digit market cap againFirst of all i like this chart a lot. Because of
1-) Enormous volume for the last 4 weeks.
2-) RSI is at the bullish side for the first time in all time
3-) Clearly deeped out and recently proved that Bull are in control.
Ambrosus's average price for 1 coin of all time is $0.16. Now it is $0.04. And i think a regaining attempt (at least the average price) is very possible.
According to Wyckoff theory (imo) AMB completed the accumulation phase and got a spring with Huge Volume.
What is next ? getting over the accumulation zone . This is not happened yet. If it happens soon this will be a very explosive one
NOTE: Bitcoin is trying to break 12k level recently so this might cause a little pull back from that level.


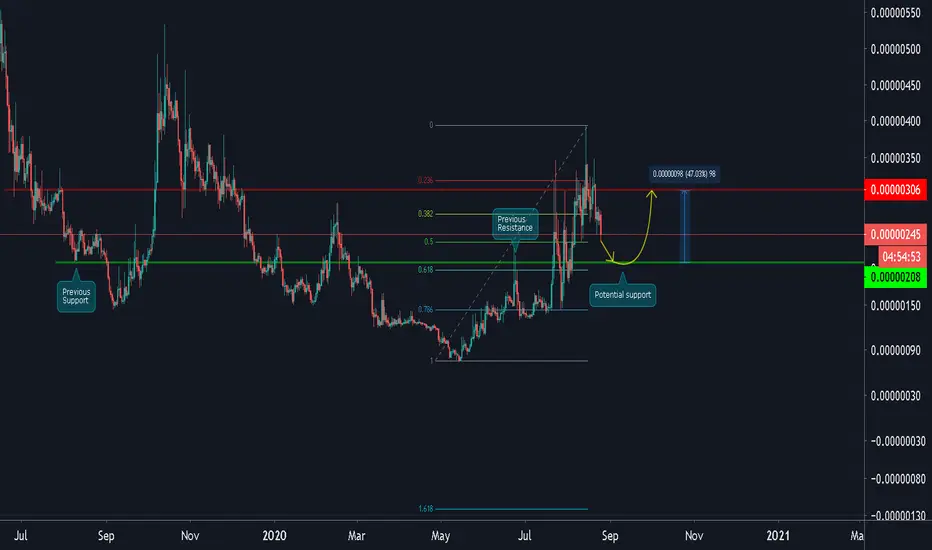
AMB/BTC (Pullback to .618 Fib Level?)AMB/BTC
-Ambrosus is likely to go down after some bearish rejections at 350 sat range
-The key area that needs to be watching is somewhere around 200 sat zone
-This is a confluence of previous support turned resistance
-Also, the 0.618 Golden Fib level is lying on this zone
-But be careful, always watch for any Bullish signs before opening an order
$AMB - A move of 50% from bottom of channel on KucoinThis will be the same scenario on Binance when they announce support of the mainnet.
Ambrosus is gearing up nicely for a nice run and it starts with moving from the bottom of the current trading channel.
This should see a 50% move up to 329 Satoshi to start with.
After that we're in a new structure and we can revisit it at 330.

AMB is like the super-volcano beneath Yellow Stonethis chjart is umbeliebable lol
long with every bone in my body already up 2x but if this thing flips support into resistance...
reeeeeeeeeeeeeeeeeeeeeeeeeee
