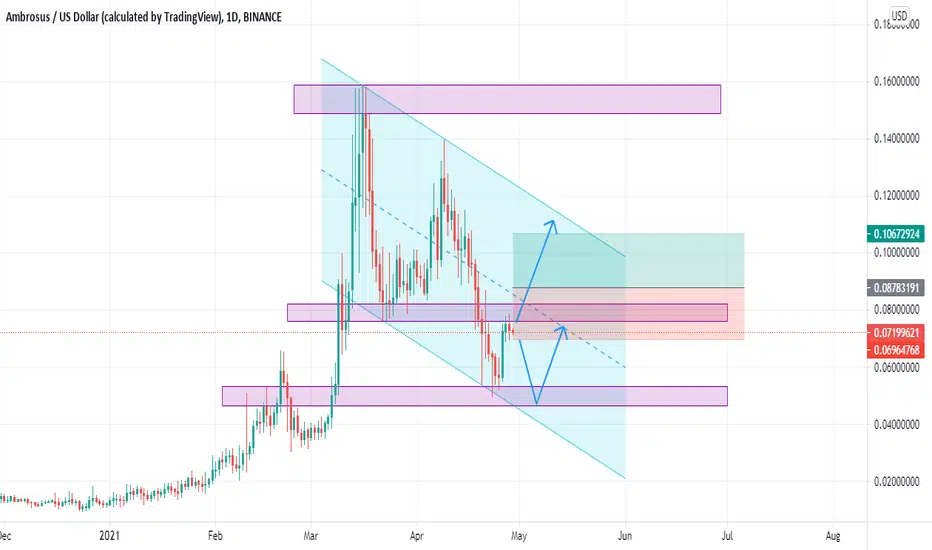
AMB - is pain over?AMB lost support range and did 1:1 move to downside - same move as in 2019-2020.
We are oversold and I expect bounce up to test S/R range that we lost.
Bull plan only if we manage to break diagonal resistance line which is holding us back for 7 years. If we break it then expect 2nd push to X-wave level and from there pullback to our S/R range for higher low.
AMBUSD trade ideas

AMB (AirDAO) - Expect huge bounce back from the supportCRYPTO:AMBUSD (1W CHART) Technical Analysis Update
AMB is currently trading at $0.00810881 and showing overall bullish sentiment
Price has hit support multiple times and always bounce backend from the support zone, this support zone has never broken in the last couple of years. Fundamentally AMB is strong token with huge potential for growth.
Entry level: $ 0.00818628
Stop Loss Level: $ 0.00424781
TakeProfit 1: $ 0.01232100
TakeProfit 2: $ 0.01819480
TakeProfit 3: $ 0.03440407
TakeProfit 4: $ 0.09336532
TakeProfit 5: $ 0.17993132
TakeProfit 6: $ 0.36364228
TakeProfit 7: $ 0.88043750
Max Leverage: Spot or 2x
Position Size: 1% of capital
Remember to set your stop loss.
Follow our TradingView account for more technical analysis updates. | Like, share, and comment your thoughts.
Cheers
GreenCrypto

AIRDAO on the comeback trail?This S coin has undergone a rebrand it seems , a main-net release?
I don't know, I rarely dive into the fundamentals of a project... whilst a narrative is nice
and sector rotation is a thing
the age of the ALT coin and any the state of the community / marketing are generally the most important.
Which is all told in the price action of the charts anyway! :)
Supply/demand ---> support/resistance ---> accumulation/distribution
anyway as this chart shows there may be life in this old dog of a S coin.
And it is currently in a low risk (USD) entry zone.
(Don't forget to keep a Moonbag in these S coins as you take profits ... as you never know if it will be blessed this cycle with extreme out performance)

AMB LOOKS BULLISHBefore anything, pay attention to the time frame, the time frame is big and time consuming.
Also note that this is a low volume and almost risky currency.
With the wave counter we had on AMB, we noticed that AMB is finishing the big C wave of a triangle or diametric/symmetrical.
By maintaining the green range, it can move towards supply.
The targets are listed on the chart.
Closing a weekly candle below the green range will violate the analysis.
For risk management, please don't forget stop loss and capital management
When we reach the first target, save some profit and then change the stop to entry
Comment if you have any questions
Thank You

AMB USDReason to buy
1. AMB is good dao coin
2. Triple bottom at 12M scenario
3. This coin is on binance.
4. This coins has not pumped
So, Ideally as per the market scenario, if this coin pump then might be pump hard. You can invest little amount and wait for overall crypto market to go insane in 2024/2025

Don't miss this great buying opportunity --- ACT NOWThis is the potential outcome if the five-year downtrend is breached.
Chart Patterns: triple bottoms, bullish engulfing patterns.
Support and Resistance Levels: The price found buying interest.
Moving Averages: 50-day moving average crossing above the 100-day moving average.
Relative Strength Index (RSI): A rising RSI from oversold levels (potential uptrend).
Volume Analysis: increasing volume.
Confirmation: Trend reversal on multiple indicators.
Good luck

Are you one of those holding a amb coins?The market cap is currently $10 million, I can tell from the price pattern that money is starting to flow out. binance has put certain coins in the innovation area where they are monitored due to their low market cap and to monitor the safety of the users who buy. Some of them were recently removed from the list because they died.
I don't know exactly what will happen to the crossbow coin, but I do know that I don't want to buy it
Maybe sometime later when amb coin is not delisted and the price pattern is good

AMB - BTC & USD Linear 3DBreak and retest resistance and i expect moon, amb airdao is a good project i love it

#ambusdt #ambbusdBullish channel in formation. Very positive. Failure of which will see us go bearish af.

Ambrosus (AMB) / USD - Regular bullish divergenceA lot is going on in this chart. Recently the chart came to my attention by another tradingview idea from a couple of months ago so I decided to spend some hours studying. In summary, it seems to me to be one of the most bullish charts for an asset listed on the Binance exchange. Every week I study all assets listed on Binance for opportunities. Today 3 came up. This is 1/3.
The small market capital is the risky part, < $6 million dollars. However the good side is the circulating supply is more than 86% of the total supply, that’s a lot better than can be said for other alt-coins.
The technical:
This token has corrected over 99% from $2. Was oversold in September of last year (orange column) creating lower highs + bottoming candle. Since then price action has been consolidating.
On the above weekly chart we have:
1) A bottoming candle created on March 2020 followed by a considerable amount of volume given the market cap.
2) Price action was rejected from resistance for the 2nd time (labelled ‘2’).
3) Price action has retraced to the golden ratio, 0.786
4) The last weekly candle printed confirmed a bullish spinning top reversal pattern.
5) Stochastic RSI crosses up 20.
6) Price action on the 3-day chart (not shown here) is in regular bullish divergence with the oscillators.
Good luck!
1st target is 40 cents or 30x from here.

AMBUSD key price levelsthere are the key price levels for AMBUSD
they can be used for short swings after paying attention to price action

AMB - Trend-Following Buy Setup!Hello everyone, if you like the idea, do not forget to support with a like and follow.
AMB is overall bullish and now approaching the lower brown trendline acting as non-horizontal support, so we will be looking for buy setups.
on H4: AMB is forming an inverse head and shoulders pattern , but it is still an idea.
Trigger => Waiting for the right shoulder to form then buy after a momentum candle close above the gray neckline.
Meanwhile, until the buy is activated, AMB would be overall bearish can still trade lower.
Good luck!
All Strategies Are Good; If Managed Properly!
~Rich

AMB/USD TARGETS (AMB/BTC)AMB started to grow with the older coins
has a few buy signal and bullish indicators
i decided to share
i usually pick the smaller target
better to be consistent than greedy (and broke)
happy
weekend

AMB Ambrosus network has released their new staking platform.
The fees are really small. Fundamentaly this is a good project in wich I think it is seriously undervalued, since it's market cap is only on the 22 Million.
Had a huge drop since 2018 and has not recovered since then. The last market crash and the selling pressure did not demotivate the team to develop and to do some really good partnerships.
This is a fibonacci based analysis. Let's hope this project moons from here.

AMBUSD - LongsBINANCE:AMBUSD
Crypto Saturdays people, AMB weekly time frame is looking good for longs, lower timeframes you could wait for more confirmed entries and breakouts but as it stands, we are looking good for another run up with first target at previous highs!

Amb busd dailyAmb making cup and handle pattern a EMAs supporting looking bullish buy after breakouts orange lines are target


$AMB - Ambrosus, a crypto mega moonshot in the making?$AMB - Ambrosus, undervalued? Long term diamond, 30X potential???


AMB/USD Short term long 19% gainsLooks good for a short term long aprox 19% profit potential. Even more long term, if you look back on my page you will find i mentioned buying this coin long before when it was at $0.013

AMB - ASCENDING TRIANGLE Ascending triangle - potential break to the upside
''Buy Big Sell BIGGER'' - MegaWhale

