$AMBMIL:AMB crashed recently for about 92% and there are rumors it could be delisted.
It has the potential to go 10X now.
AMBUSDT trade ideas

AMB COIN PRICE ANALYSIS... NEXT POSSIBLE MOVES AND TRADE SETUP.MIL:AMB Coin Update!!
• Before Delisting From Binance i am expecting now pottential bounce back in its price from mentioned areas🫡
• you are able to build trade on it with SL If it's meet your strategy as i shared possible setup on a chart✅
• Risk level will be too high so i will recommend if you normally use 100$ in single trade then now use only 20$-30$ max.
Warning : That's just my analysis DYOR Before Taking any action🚨

AMB/USDTKey Level Zone: 0.004020 - 0.004060
HMT v5 detected. The setup looks promising, supported by a previous upward/downward trend with increasing volume and momentum, presenting an excellent reward-to-risk opportunity.
HMT (High Momentum Trending):
HMT is based on trend, momentum, volume, and market structure across multiple timeframes. It highlights setups with strong potential for upward movement and higher rewards.
Whenever I spot a signal for my own trading, I’ll share it. Please note that conducting a comprehensive analysis on a single timeframe chart can be quite challenging and sometimes confusing. I appreciate your understanding of the effort involved.
Important Note :
Role of Key Levels:
- These zones are critical for analyzing price trends. If the key level zone holds, the price may continue trending in the expected direction. However, momentum may increase or decrease based on subsequent patterns.
- Breakouts: If the key level zone breaks, it signals a stop-out. For reversal traders, this presents an opportunity to consider switching direction, as the price often retests these zones, which may act as strong support-turned-resistance (or vice versa).
My Trading Rules
Risk Management
- Maximum risk per trade: 2.5%.
- Leverage: 5x.
Exit Strategy
Profit-Taking:
- Sell at least 70% on the 3rd wave up (LTF Wave 5).
- Typically, sell 50% during a high-volume spike.
- Adjust stop-loss to breakeven once the trade achieves a 1.5:1 reward-to-risk ratio.
- If the market shows signs of losing momentum or divergence, ill will exit at breakeven.
The market is highly dynamic and constantly changing. HMT signals and target profit (TP) levels are based on the current price and movement, but market conditions can shift instantly, so it is crucial to remain adaptable and follow the market's movement.
If you find this signal/analysis meaningful, kindly like and share it.
Thank you for your support~
Sharing this with love!
HMT v2.0:
- Major update to the Momentum indicator
- Reduced false signals from inaccurate momentum detection
- New screener with improved accuracy and fewer signals
HMT v3.0:
- Added liquidity factor to enhance trend continuation
- Improved potential for momentum-based plays
- Increased winning probability by reducing entries during peaks
HMT v3.1:
- Enhanced entry confirmation for improved reward-to-risk ratios
HMT v4.0:
- Incorporated buying and selling pressure in lower timeframes to enhance the probability of trending moves while optimizing entry timing and scaling
HMT v4.1:
- Enhanced take-profit (TP) target by incorporating market structure analysis
HMT v5 :
Date: 23/01/2025
- Refined wave analysis for trending conditions
- Incorporated lower timeframe (LTF) momentum to strengthen trend reliability
- Re-aligned and re-balanced entry conditions for improved accuracy

AMBUSDT: Will a Bullish Reversal Happen?Yello, Paradisers! Are you ready for the next potential move on AMBUSDT?
💎AMBUSDT is looking strong after a healthy retracement and has now entered the oversold zone—an exciting development for traders.
💎Currently, the price is approaching a critical support zone and showing signs of bullish divergence, which increases the likelihood of an upside move. However, confirmation is key before jumping in. Here's what we’re watching:
💎Scenario 1: For confirmation of a bullish move, we need to see a bullish I-CHoCH (Internal Change of Character) on the lower timeframe once the price reaches the strong support zone.
💎Scenario 2: Alternatively, a breakout and candle close above the resistance trendline with proper volume will also confirm bullish momentum.
💎However, If the price breaks down and closes candle below the strong support zone, the entire bullish outlook will be invalidated. In that case, patience will be key—we’ll wait for a clearer price action setup to form before making any moves.
🎖Remember, Paradisers, trading isn’t about rushing in—it’s about disciplined, calculated decisions. Waiting for the right confirmation can save you from unnecessary losses and keep you on track for long-term success. Stay focused, stick to the plan, and trade smart!
MyCryptoParadise
iFeel the success🌴

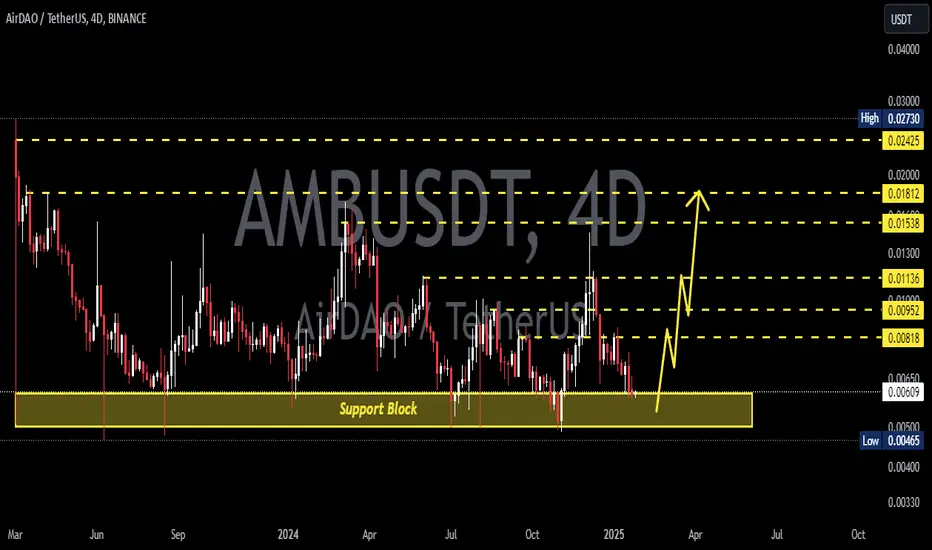
AMBUSDT 4DAMB ~ 4D Analysis
#AMB Time frime 4D continues to maintain this support block. This is the right time to start buying back with a minimum target of 20%+
#AMB/USDT Ready to go higher#AMB
The price is moving in a descending channel on the 30-minute frame and sticking to it well
We have a bounce from the lower limit of the descending channel, this support is at 0.00688
We have a downtrend on the RSI indicator that is about to break, which supports the rise
We have a trend to stabilize above the moving average 100
Entry price 0.00700
First target 0.00721
Second target 0.00736
Third target 0.00754

SPOT AMB LONG 21.12.2024Fixation after exhaustion of sales.
🎯Purpose:
0.01403
‼️Risk per trade: 0.5% of the allocated funds for spot trading.
Thank you for subscribing and responding🚀.

AirDAO (AMB) AnalysisAMB seem to be in a bearish spree. It had a parabolic (almost) 70% move up from 0.0085. Since then coin is retracing back to key levels:
- trendline from weekly at 0.009
- fib retracement level of 0.618 at around 0.00858
- 0.00858 is also a key support zone from weekly timeframe
I would expect a move up from 0.00858 and 0.009 zone

AMBUSDT (AirDAO) Updated till 06-12-24AMBUSDT (AirDAO) Daily timeframe range. we can see a clean push here right at 0.01423. there are some sellers around this resistance but at this volume its not that hard to clear it out. if buyers keeps up it will get back to its mid range. recent support at 0.00987.

200% minimum for AMBAlt season is here, strong coin, strong PA and TA... bulls are in the city already. WIth patience this can bring more than 200%
NOT A FINANCIAL ADVICE
ALWAYS USE STOPLOSS AND MANAGE YOUR RISK

AMB/USDT Long SetupAMB/USDT Long Setup
Reason:
Breakout from Ascending Triangle with strong volume.
Successfully tested the support and resting on it.
LTF is bullish, expecting sudden strong bullish wave.
All technical indicators suggesting bullish momentum in short term.
Recommendation is to buy in spot, for futures take it at Dca point to be on safe side.
Best Regards,
The Crypto Panda
BINANCE:AMBUSDT
KUCOIN:AMBUSDT
MEXC:AMBUSDT.P
BYBIT:AMBUSDT.P

SPOT AMB LONG 3.12.2024🎯Purpose:
0.01201
‼️We enter at 0.5% of the allocated money for spot trading.

AMBUSDT.P LongAMBUSDT.P Long
Breakout retest
.006686
TP - .008687
SL - 10%
Dyor
Tyor
Use low level only!
Happy trading!

#AMB/USDT is holding the Diagonal Trendline in 1-Hour TF!#AMB/USDT is holding the Diagonal Trendline in 1-Hour TF!
I will wait for a reaction after tapping 1H FVG before shorting it. MIL:AMB local resistance level is PMH $0.008119, and the support level PML is $0.005425.

#AMB/USDT#AMB
The price is moving in a downward channel on the 4-hour frame upwards and is expected to continue
We have a trend to stabilize above the moving average 100 again
We have a downward trend on the RSI indicator that supports the rise by breaking it upwards
We have a support area at the lower limit of the channel at a price of 0.00545
Entry price 0.00600
First target 0.00666
Second target 0.00716
Third target 0.00772

#AMB/USDT#AMB
The price is moving within a bearish channel pattern on the 4-hour frame, which is a strong retracement pattern
We have a bounce from a major support area in green at 0.00620
We have a tendency to stabilize above the Moving Average 100
We have an upward trend on the RSI indicator that supports the rise and gives greater momentum, upon which the price depends
Entry price is 0.00650
The first target is 0.00734
The second goal is 0.00790
The third goal is 0.00854

Keep an eye on #AMB/USDT 1-Hour FVG!Keep an eye on #AMB/USDT 1-Hour FVG!
MIL:AMB needs to tap and bounce back with bullish engulfing to long it. The local resistance level is PDH $0.00636.

Trade Signal for AMBUSDT - Sell OpportunityWe have identified a selling opportunity for the AMBUSDT currency pair, based on our analysis using the EASY Quantum Ai strategy. Below, you'll find the detailed trade parameters and the rationale for this signal.
Trade Details:
- Direction: Sell
- Enter Price: 0.00819
- Take Profit: 0.00797333
- Stop Loss: 0.00852333
Rationale:
1. Technical Analysis: The moving averages, coupled with a downward momentum indicator, suggest a bearish continuation pattern. The current price action shows a weakness in the upward movement offering a prime sell position at 0.00819.
2. Market Sentiment: Recent trends in market sentiment indicators hint at a shift towards risk aversion, triggering likely sell-off in this pair.
3. Volume Analysis: A gradual increase in selling volume reinforces the potential for a downward movement aligning with our take profit target.
The above factors suggest that the AMBUSDT pair could depreciate, providing an advantageous entry point for traders executing a sell strategy. This analysis relies on the robust capabilities of the EASY Quantum Ai strategy, aimed at optimizing entry and exit points for enhanced trading performance. Always ensure to manage your risk effectively with the prescribed stop loss at 0.00852333. Trade wisely!

AMBUSDTAMB ~ 1W ✅
#AMB So far this Key Support continues to maintain price.
✅ If you are interested in this coin, this support Block would be an excellent purchase. at least for 20%++ profit

AMB/Usdt Plan AMB/USDT Plan
The price is currently trading in a triangle pattern, and I expect a breakout soon. The market structure is bullish, so keep a close eye on it. Remember, this is not financial advice—always do your own research.

AMB is bullish (12H)It looks like a flat pattern with a terminal C, it's finished.
Wave C has been a 5-wave that just seems to have ended.
The targets are listed on the chart.
By maintaining the green range, it can move towards the targets.
Closing a daily candle below the invalidation level will violate the analysis.
For risk management, please don't forget stop loss and capital management
When we reach the first target, save some profit and then change the stop to entry
Comment if you have any questions
Thank You

AMBUSDT: Low Market Cap GemAMBUSDT Technical analysis update
One of the lowest market cap coins listed on Binance currently has a market cap of $25M. It could potentially reach $250M during this bull run.
The price is currently forming a triangle pattern. Once the price breaks out, we can expect a strong bullish move in AMB, with a target of 500% to 1000%.

Keep an eye on the #AMB/USDT Diagonal Trendline in 1-Hour TF!Keep an eye on the #AMB/USDT Diagonal Trendline in 1-Hour TF!
MIL:AMB needs to clear the trendline to turn bullish. The local resistance level is PMH $0.008442, and the support level is $0.00722.
