AMB. 0.0099. LONGThe token looks very strong. We are going to an important level retest. There is a large accumulation. The token does not roll back from the level; the buyer holds the price. In front we have free space and the potential for good movement.
AMBUSDT trade ideas

#AMBUSDTA bullish flag is a technical analysis pattern that indicates a potential continuation of a uptrend. When the price breaks out of the flag pattern, it can lead to a massive bullish wave in the midterm

AMBUSDT 1000% Potential!AMBUSDT technical analysis update
AMB has been trading within a range for the last 525 days, and it is now bouncing from its major support level with high volume. We can expect a strong bullish move from the current level.
AMB is one of the lowest market cap coins listed on Binance, with a current market cap of $25 million. It could potentially reach $250 million by the end of 2025.
Regards
hexa

AMBUSDT.1DThis analysis of the AMB/USDT chart indicates several critical observations and possible future directions:
Technical Analysis
Resistance and Support Levels (R1, R2, S1, T):
The chart clearly shows that after hitting the resistance level at R2, the price experienced a significant drop, which it has not recovered from. Currently, it is testing the support level S1.
The downtrend line (marked in red) serves as a dynamic resistance level, and the recent bounce off this line suggests that the bearish momentum is still in control.
MACD Indicator:
The Moving Average Convergence Divergence (MACD) is below the signal line and has been descending, which indicates a bearish market scenario. The histogram also supports this, as it is in the negative territory, reinforcing the strength of the downtrend.
RSI:
The Relative Strength Index (RSI) is close to the oversold region but not yet below 30, which might indicate that there's still room for downward movement before any potential reversal might occur.
Price Target (T):
The highlighted target (T) near the S1 line suggests an expectation of further price declines. If the price breaks below S1, it could accelerate the bearish trend, potentially leading to new lows.
Conclusion
In the current market condition, the trend is decisively bearish. Key indicators like MACD and RSI support this view. For potential investors or traders, it would be prudent to wait for a trend reversal signal before entering long positions. If the price sustains below the S1 level, considering short positions or waiting out the volatility might be advisable until a clearer bullish signal emerges. Caution is recommended, as the market shows strong bearish indicators.

AMB analysisAMB's major structure is bearish. Now we can consider the wave that moved upwards as a substructure.
So we are looking for sell/short positions in supply ranges.
In the specified supply range, we can look for sell/short positions.
The target can be the range of demand.
Closing a daily candle above the invalidation level will violate the analysis
Note that the financial market is risky, so:
Do not enter a position without setting a stop and capital management and confirmation and trigger.
When we reach the first TP, save some profit and try to move the stop continuously in the direction of your profit.
If you have any comments please post them, comments will help us improve our performance
Thanks

Intraday. AMB. 0.0096. LONGThe token does not roll back after a strong upward movement and does not react to a false breakout. The seller is strong and does not give up his position. The token is going to retest the level and can give a good long breakout impulse.

AMBUSDT(AirDAO) Daily tf Range Updated till 02-08-24AMBUSDT(AirDAO) Daily timeframe range. its on Monitoring state at binance so gotta trade it carefully. now it retraced quite a space from its new low. trying to stay over 0.00926 but still need a valid close for that. local support point at 0.00714.

Intraday, AMB, 0.008050, LONGIntraday idea.
The token is stronger than the market and does not react to BTC rollbacks, sellers keep the price at the level itself and do not allow it to roll back even after a false breakout, a large accumulation below the level can serve as a source of the initial breakout impulse. There is emptiness ahead; nothing will stop the token from moving forward.

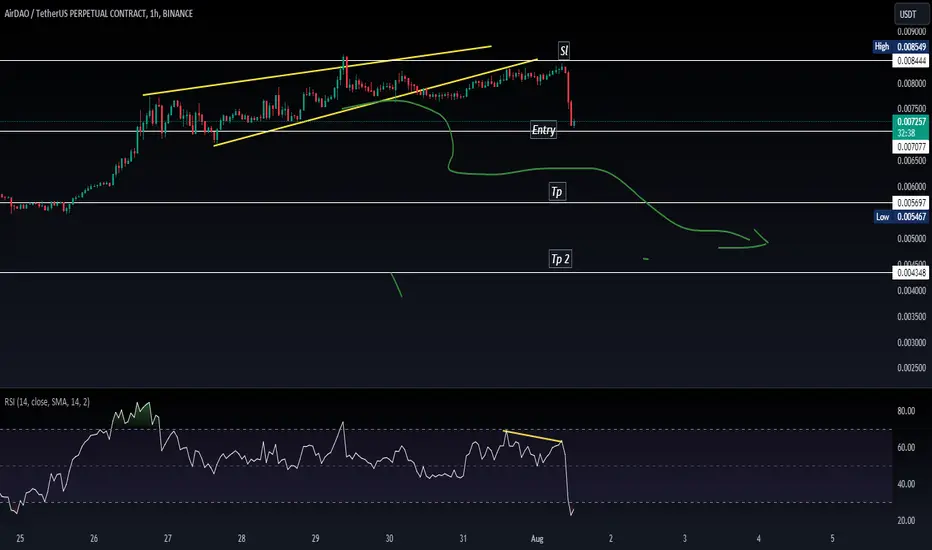
AMBUSDT.PAMBUSDT.P just enter into the bearish trend.
Divergence in 1 HR and 4hr tF
We wait for the further confirmation.
we wait and watch for the breakout of last LL.
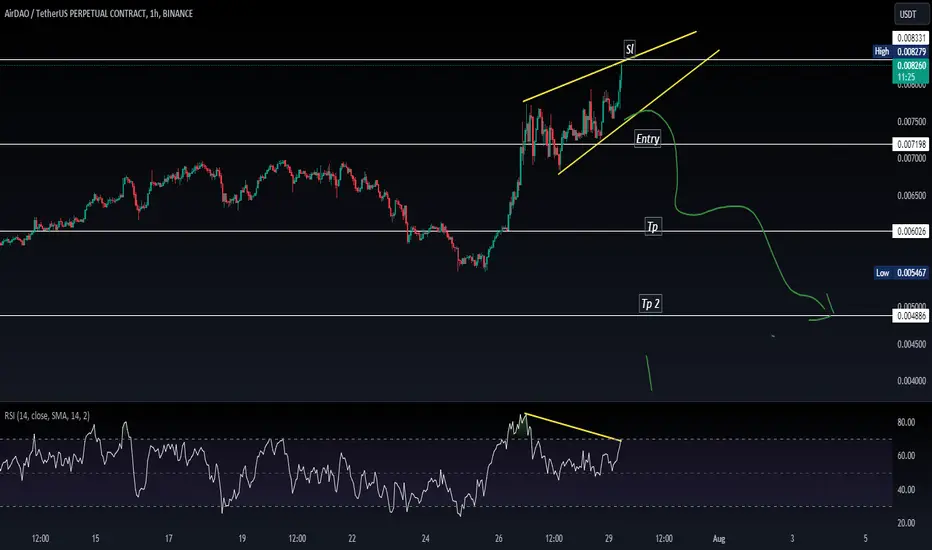
AMBUSDT.PAMBUSDT.P is in bullish trend.
Bearish divergence shown in RSI,
Bearish Risign wedge reversal pattern also form.
The scores of reversal is good so we wait for more confirmation if it breaks the last HL then we will execute trade.
AMB Technical Analysis in 3-Day Timeframe.Hello everyone, I’m Cryptorphic.
For the past seven years, I’ve been sharing insightful charts and analysis.
Follow me for:
~ Unbiased analyses on trending altcoins.
~ Identifying altcoins with 10x-50x potential.
~ Futures trade setups.
~ Daily updates on Bitcoin and Ethereum.
~ High time frame (HTF) market bottom and top calls.
~ Short-term market movements.
~ Charts supported by critical fundamentals.
Now, let’s dive into this chart analysis:
The AMB/USDT pair is currently showing a rebound from the support level. The technical indicators suggest a potential bullish move if the price can break above the 21 EMA at $0.00738.
With the continuation of this rebound, we can expect AMB to test the decreasing resistance trendline at $0.0124.
The lower support at $0.005 remains solid and can also be considered an invalidation point for this rally.
Trade Setup:
- Entry Point: $0.005 to CMP.
- Target: $0.0120 (122.33% gain).
- Stop Loss: If AMB closes below the $0.005 support level, we can consider this chart invalid.
DYOR, NFA.
Please hit the like button to support my content and share your thoughts in the comment section. Feel free to request any chart analysis you’d like to see!
Thank you!
#PEACE

$AMB ready for next moves MIL:AMB ready for next moves
Bags are packed ✍️
We are going to see $0.02 soon for this one, undervalued gem 🔥

AMBUSDT Inverse Head & ShouldersAMBUSDT
Inverse Head & Shoulders pattern. Price is also holding above 200 EMA.
SL: 0.007612

#AMB\USDT#AMB
The price is moving in the direction of forming a head and shoulders pattern on a 1-hour frame. The price is moving within it and adhering to it to a large extent.
We have a support area in green and
bounced from it at the level of 0.00700.
We have a trend to hold above moving average 100.
We have a downtrend on the RSI indicator that supports the rise and is about to break higher
Entry price is 0.00820
The first target is 0.00936
The second goal is 0.01103
The third goal is 0.01290

#AMB/USDT LONG#AMB
The price has been moving in a descending triangle since April 2022
Expect a breakout of the downtrend to turn the trend.
We have a strong reversal pattern.
We have oversold on MACD.
Current price 000823
First Goal 0.01228
Second Goal 0.01484

AMB/USDT Ready to Claim its Crown Back? 👀🚀AMB Analysis💎Paradisers, let's dive into #AMBUSDT, as it showcases significant market movements with an upcoming retest of the Bullish Order Block (OB) within a descending channel.
💎Currently, #AirDAO is on the brink of reevaluating the demand zone following its encounter with the descending channel's resistance. There's a promising chance for the price to spring from this zone, aiming for an ascent with the bearish OB region as its next landmark.
💎However, if MIL:AMB doesn't manage to rally and instead slips below the demand zone, we might see a regression to the Bullish OB vicinity at approximately $0.0073, where it could garner strength for another upward journey.
💎The Bullish OB zone has historically been pivotal, reliably initiating significant rebounds upon testing. Yet, if this zone were to falter, solidifying a bearish trend, the price may seek to follow a bullish path from a subordinate position.
💎If #AMB does not seize the momentum from this or a further reduced level, a continued decline is anticipated. Rest assured, your Paradise Team is closely observing these shifts, prepared to assist you through these intricate market dynamics.

AMB/USDT IDEA AMB/USDT is currently exhibiting a symmetrical triangle pattern, indicating a potential breakout in the near future. If the breakout is successful, a strong bullish rally could be anticipated. Please note that this is not financial advice, and it is always recommended to wait for confirmation and conduct your own research (DYOR) before making any trading decisions.

Air Dao / AMB Buy Call Crossing trend Line after reconfirmationHi Guys
AMB looking bullish after it crosses 3D trend line and did reconfirmation as well.
My first target will be 0.2360 and SL 0.012
In lower time frame its also going to cross the channel and invalidating the double top.
regards

#AMB/USDT#AMB
We are in a descending triangle and have now broken upward
We have upward momentum and support from a good area from which the price has been bouncing for a long time
The price is expected to trade in an upward wave with price corrections
Current price 0.00812.
First goal: 0.00930.
The second target is 0.01041
The third goal is 0.01227

AMBUSDT.4HThis chart depicts the 4-hour price movement of Ambrosus (AMB) against Tether (USDT), with various technical analysis tools applied:
Ichimoku Cloud: The price is currently below the Ichimoku cloud, suggesting a bearish trend. The cloud acts as a dynamic resistance zone.
Resistance Levels (R1, R2): The chart shows resistance levels at 0.0153 USDT (R1) and 0.01747 USDT (R2). These levels could pose challenges for the price if it attempts to rally.
Support Levels (S1, S2): Support is established at 0.01181 USDT (S1) and a lower support at 0.00960 USDT (S2). These areas may offer potential bounce points if the price continues to decline.
MACD (Moving Average Convergence Divergence): The MACD line is very close to the signal line, suggesting a lack of strong momentum in either direction.
RSI (Relative Strength Index): The RSI is hovering around 46, indicating neither overbought nor oversold conditions, suggesting the potential for movement in either direction.
Given the bearish signal from the Ichimoku Cloud and the lack of momentum indicated by the MACD, I would watch for a potential retest of the cloud from below. If the price fails to break through the cloud, it could indicate a continuation of the downtrend. The RSI being neutral suggests some indecision in the market. Therefore, I would be cautious about entering long positions unless there's a clear bullish reversal signal, potentially supported by increased volume. In case of further decline, I’d look at S1 and S2 as key areas to observe for possible entries, always keeping in mind to set stop losses to manage risks. The evolving market conditions should be monitored closely, along with any news or events that might affect AMB's price.

#AMBUSDT Long#AMB
The price reached the support level at the lower border of the ascending triangle
The price is expected to bounce up again and break the pattern upward
Current price is 0.00694
The first target is 0.00809
The second goal is 0.00930
The third goal is 0.01040
The fourth goal is 0.01227

AMB/USDT Rejected on the supply, Could AMB breakout the area?💎 AMB has recently demonstrated significant market dynamics. After encountering rejection upon reaching the Bearish OB area, AMB retraced back to the demand area in preparation for a potential breakout.
💎 If AMB successfully breaks out above the Bearish OB area, it could indicate a continuation of the upward movement, with the probability for the price to reach our target area.
💎 However, if AMB fails to break out shortly, there is a possibility of the price returning to the demand area.
💎 The situation worsens if AMB breaks down below the demand area, as this would signal a shift back to a downward trajectory. In such a scenario, the price may decline further towards the support area or even lower levels.

AMB UNEXPECTED FLOW - VOLUME INTERESTAMB seems to have to unexpected trend flow that could get confirmation of an increased trend.
coming time frames can be very important.
There is high volume interest.
