Africa in my dream.....I dreamt of Africa two days ago and it was blurry one that I cannot recalled the content. But the word stuck with me - Africa. I have neither any friends nor business dealings with Africa so I find it perplexed and confused why it comes to my dream.
A quick look at the weekly chart of this ETF sho
Key stats
About VanEck Africa Index ETF
Home page
Inception date
Jul 10, 2008
Structure
Open-Ended Fund
Replication method
Physical
Dividend treatment
Distributes
Distribution tax treatment
Qualified dividends
Income tax type
Capital Gains
Max ST capital gains rate
39.60%
Max LT capital gains rate
20.00%
Primary advisor
Van Eck Associates Corp.
Distributor
Van Eck Securities Corp.
AFK provides exposure to the whole African continent and not just South Africa. The fund focuses on gross domestic product (GDP) rather than market cap. This places the emphasis on each country's economic footprint rather than the market value of equity. The index takes a broad approach to eligibility: It includes companies from all caps that earn a majority of revenues in Africa, rather than restricting eligibility to companies domiciled in the continent. A minimum of 25 constituents will compose the index and their weights are capped at 8%. The index is reviewed quarterly, while GDPs are reviewed annually in June.
Related funds
Classification
What's in the fund
Exposure type
Finance
Non-Energy Minerals
Communications
Stock breakdown by region
Top 10 holdings
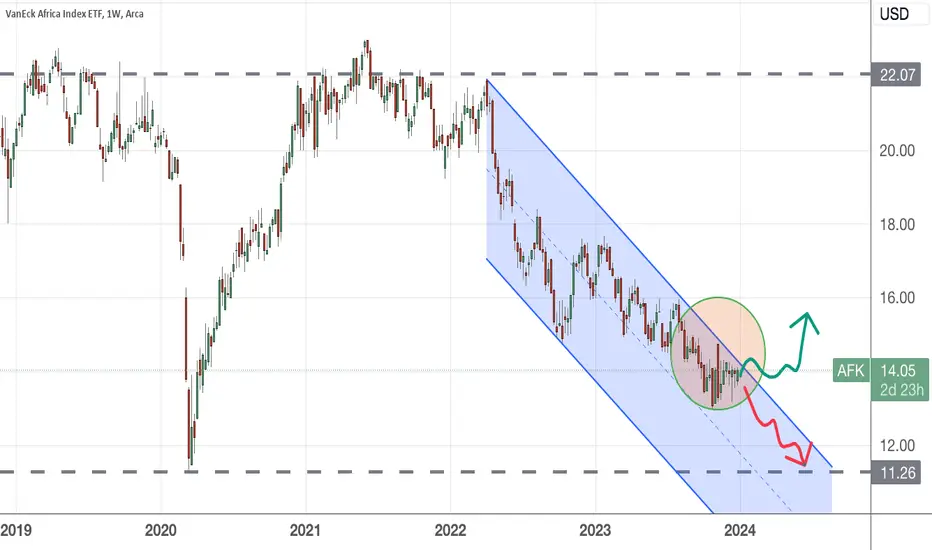
Africa is an underdogAfrica ETF $AFK testing multiyear downtrend with an inverted head and shoulders pattern. Testing the 72/89 EMA cloud. Breakout to the upside would likely go at least 15% up.

AFRICAWould be looking to buy this down in the 17 area
Should do well longer term
NOT TRADING ADVICE
GRI 2022

Could Become A Great Buy - AFKA rather unique ETF tracking companies based in Africa -not just South Africa.
The region has been hurt in the whole emerging turmoil and is clearly in a bear trend.
If the index goes further down and hits support level, this will be a very interesting buy for the long-run, especially considering th

Conservative move on this african tracking ETFFuck knows what this ETF comprises of. I checked but I don't know any of those companies lol. I'm bullish nonetheless. Enter @25$


See all ideas
Summarizing what the indicators are suggesting.
Oscillators
Neutral
SellBuy
Strong sellStrong buy
Strong sellSellNeutralBuyStrong buy
Oscillators
Neutral
SellBuy
Strong sellStrong buy
Strong sellSellNeutralBuyStrong buy
Summary
Neutral
SellBuy
Strong sellStrong buy
Strong sellSellNeutralBuyStrong buy
Summary
Neutral
SellBuy
Strong sellStrong buy
Strong sellSellNeutralBuyStrong buy
Summary
Neutral
SellBuy
Strong sellStrong buy
Strong sellSellNeutralBuyStrong buy
Moving Averages
Neutral
SellBuy
Strong sellStrong buy
Strong sellSellNeutralBuyStrong buy
Moving Averages
Neutral
SellBuy
Strong sellStrong buy
Strong sellSellNeutralBuyStrong buy
Displays a symbol's price movements over previous years to identify recurring trends.
Frequently Asked Questions
An exchange-traded fund (ETF) is a collection of assets (stocks, bonds, commodities, etc.) that track an underlying index and can be bought on an exchange like individual stocks.
AFK trades at 21.88 USD today, its price has risen 0.87% in the past 24 hours. Track more dynamics on AFK price chart.
AFK net asset value is 21.59 today — it's risen 5.48% over the past month. NAV represents the total value of the fund's assets less liabilities and serves as a gauge of the fund's performance.
AFK assets under management is 60.96 M USD. AUM is an important metric as it reflects the fund's size and can serve as a gauge of how successful the fund is in attracting investors, which, in its turn, can influence decision-making.
AFK price has risen by 8.10% over the last month, and its yearly performance shows a 41.99% increase. See more dynamics on AFK price chart.
NAV returns, another gauge of an ETF dynamics, have risen by 5.48% over the last month, showed a 17.40% increase in three-month performance and has increased by 38.34% in a year.
NAV returns, another gauge of an ETF dynamics, have risen by 5.48% over the last month, showed a 17.40% increase in three-month performance and has increased by 38.34% in a year.
AFK fund flows account for −2.60 M USD (1 year). Many traders use this metric to get insight into investors' sentiment and evaluate whether it's time to buy or sell the fund.
Since ETFs work like an individual stock, they can be bought and sold on exchanges (e.g. NASDAQ, NYSE, EURONEXT). As it happens with stocks, you need to select a brokerage to access trading. Explore our list of available brokers to find the one to help execute your strategies. Don't forget to do your research before getting to trading. Explore ETFs metrics in our ETF screener to find a reliable opportunity.
AFK invests in stocks. See more details in our Analysis section.
AFK expense ratio is 0.88%. It's an important metric for helping traders understand the fund's operating costs relative to assets and how expensive it would be to hold the fund.
No, AFK isn't leveraged, meaning it doesn't use borrowings or financial derivatives to magnify the performance of the underlying assets or index it follows.
In some ways, ETFs are safe investments, but in a broader sense, they're not safer than any other asset, so it's crucial to analyze a fund before investing. But if your research gives a vague answer, you can always refer to technical analysis.
Today, AFK technical analysis shows the buy rating and its 1-week rating is strong buy. Since market conditions are prone to changes, it's worth looking a bit further into the future — according to the 1-month rating AFK shows the buy signal. See more of AFK technicals for a more comprehensive analysis.
Today, AFK technical analysis shows the buy rating and its 1-week rating is strong buy. Since market conditions are prone to changes, it's worth looking a bit further into the future — according to the 1-month rating AFK shows the buy signal. See more of AFK technicals for a more comprehensive analysis.
AFK trades at a premium (1.36%).
Premium/discount to NAV expresses the difference between the ETF’s price and its NAV value. A positive percentage indicates a premium, meaning the ETF trades at a higher price than the calculated NAV. Conversely, a negative percentage indicates a discount, suggesting the ETF trades at a lower price than NAV.
Premium/discount to NAV expresses the difference between the ETF’s price and its NAV value. A positive percentage indicates a premium, meaning the ETF trades at a higher price than the calculated NAV. Conversely, a negative percentage indicates a discount, suggesting the ETF trades at a lower price than NAV.
AFK shares are issued by Van Eck Associates Corp.
AFK follows the MVIS GDP Africa. ETFs usually track some benchmark seeking to replicate its performance and guide asset selection and objectives.
The fund started trading on Jul 10, 2008.
The fund's management style is passive, meaning it's aiming to replicate the performance of the underlying index by holding assets in the same proportions as the index. The goal is to match the index's returns.