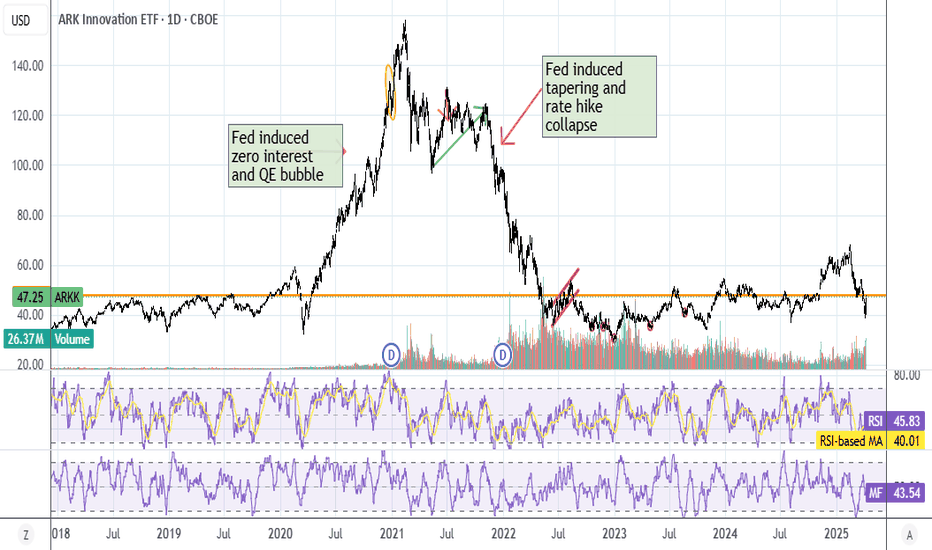
I am not bearish this time!Find one person on this platform who published more bearish ideas about ARKK in the past 4 years and I give you 1-month free access to this platform (1500 TV coin)!Longby Moshkelgosha117
$ARKK caught a #Whale in $55C 1/17/2024 (Profit Target @ $69)5,000 Open Interest on this contract until this morning when we found a whale/institution buying up probably 10k 55C contracts for Jan 17... This is a HIGH RISK HIGH REWARD PLAY given the holdings in AMEX:ARKK , but something tells me it can get to MONKEY ie $69 , and some whale or some bank also believes the juice could be worth the squeeze on this former high flyer... Past All Time Highs at $158 ... $53 now = Buy Low? - Probabilities_R_UsLongby Prophecies_R_Us3
ARKK Innovation ready to Boom? Kathy Woods ARKK Innovation fund has been completely beaten down over the course of 2 years, down over 80% from the peak of the 2021 bull market. After trading in an accumulation zone for many months, we have broken out of the value ranges, as well as the overall consolidation zone marked in the green box, which presented to be a resistance zone that should be turning into support. Technology and innovation will likely lead the market gains with new developments in AI as well as Crypto that could really send this ETF far above previous highs. Presently, I would like to see liquidity tapped just above $70, marked on the chart. Before a slight pullback and rip. We are currently approx 25% away from this zone, which will likely be a take profit zone. One major confluence for a strong rally for me will be a break and acceptance into the previous range sitting at $75. From there, the range point of control sits a whopping 60%, which could initiate a large move higher. The anchored vwap from the high may provide some resistance at the moment, I would look for a break and retest as a confirmation that the trend is truly changing here. As always, only time will tell. Good luck! Longby afurs1Updated 114
ARKK Breakout: Targeting $80 with Volume and Momentum on Its SidARKK is looking primed for a breakout, with some exciting moves on the chart. Resistance Break: After grinding below $54, ARKK finally pushed through, eyeing a bold target around $80—a potential 48% gain from here. The Gap Factor: ARKK left a gap around $48 on its recent run-up, hinting at strong demand. If momentum cools, this gap could act as a magnet for a quick retest, adding some extra intrigue to the setup. Trend & Momentum: The SMA 150 is starting to level out, suggesting a potential shift in long-term momentum. RSI is touching overbought territory, signaling heavy interest, though a brief pause wouldn’t surprise. Bottom Line: Volume is backing this breakout, and with well-defined patterns and targets, ARKK’s chart is setting up for an interesting ride ahead.Longby GarryBlackUpdated 0
ARK Innovation fund ETF - consolidation then upside break Bullish on ARK so long as and I expect that the price can stay above the bottom ascending sloping trend line. Then breaks to upside out of some form of consolidation shown as for example a triangle pattern. The market has miss priced her fund - I do not own any and no biased love listening to her updates and its really tough being in innovation and waiting for the rest of the world to catch up to her ideas. Fingers crossed that Kathy's dreams come true! Love to have a sit down and have a cup of tea with her and her team! She always has good people around her. That her funds price takes off and gets back to where it should be ! There are lots more ideas out there, financial modelling big picture thinkers! World needs more of these people! A fund could buy on the trend line and remain in the greenLongby William_Playfair1
Opening (IRA): ARKK October 18th 36/43/43/50 Iron Fly... for a 3.68 credit. Comments: >35% IV. Doing a smidge of nondirectional here in ARKK, which is toward the top of my ETF board for 30-day IV behind BITO, TQQQ, and SMH (which I already have positions in). Structuring this as a risk one to make one, which is what I like to see out of these. Metrics: Buying Power Effect: 3.32 Max Profit: 3.68 ROC at Max: 110.84% 25% Max: .92 ROC at 25% Max: 27.71% Will look to take profit at 25% max. These generally aren't managed intraexpiry; they work or they don't ... .by NaughtyPinesUpdated 0
ARKK building a base ready to launchARKK has been building a base with two sets of 1-2, 1-2 waves, which erased RSI divergence of the previous pivot. On the weekly it is also wrapping around the 50 MA in an ascending channel. Last week's momentum signals it is most likely to launch to break out of the channel.Longby TraderBwater0
Opening (IRA): ARKK Sept 20th 38 Covered Call... for a 36.93 debit. Comments: High IVR/IV (77.6/43.3). Selling the -75 call against long stock to emulate the delta metrics of a 25 delta short put, but with the built-in defense of the short call. Metrics: Break Even/Buying Power Effect: 36.93 Max Profit: 1.07 ($107) ROC at Max: 2.90% 50% Max: .54 ROC at 50% Max: 1.45% Longby NaughtyPinesUpdated 1
ARKK LongARKK is close to finishing it's consolidation move for a move back up to around $80. I'm long.Longby doggyhouse48Updated 6
AARK - Triangle fall back and run or its already off ? If bullish then AARK - Triangle fall back and run or its already off ? Longby William_Playfair223
ARKK RELATIVE SPYseems to be another classicccccc quad bottom reversal.. am i right ? it is that easy? yes Longby Vogtna1
Opening (IRA): ARKK July 19th 41 Monied Covered Call... for a 39.64 debit. Comments: After taking off my 44 monied for a small profit, re-upping with a setup in the same expiry, but with a better break even. Selling the -75 call against a one lot of stock to emulate the delta metrics of a 25 delta short put, but with built-in short call defense. Metrics: Buying Power Effect/Break Even: 39.64 Max Profit: 1.36 ROC at Max: 3.43% ROC at 50% Max: 1.72% Will generally look to take profit at 50% max.Longby NaughtyPinesUpdated 1
Opening (IRA): ARKK July 19th 39 Short Put... for a .77 credit. Comments: Adding a short put element to my ARKK covered call position on weakness.Longby NaughtyPinesUpdated 0
ARK - UP then DOWN then UPARK will break out from the resistance line at $55. It'll reach maybe $90 or $100 before crashing hard (like the rest of the stock market). Rebuy in 2026 IMO.Longby brian76830
Opened (IRA): ARKK July 19th 40 Short Put... for a 1.01 credit. Comments: Adding a short put here in the vicinity of the 25 delta out in July with a break even better than what I currently have on for my covered call. (See Post Below). Will generally look to take profit at 50% max.Longby NaughtyPinesUpdated 0
#ARKK to have a strong recovery Target 1 I expect to come quite quickly ... closely correlating to a strong bounce in #BITCOIN My overall thesis for an Equity top in April 20024 is now firmly in place. Longby BallaJiUpdated 226
Opening (IRA): ARKK May 17th 44 Monied Covered Call... for a 43.00 debit. Comments: High IVR/IV at 52.7/38.7. Going monied here, buying a Johnny one lot and selling the -75 delta call against to emulate the delta metrics of a 25 delta short put to take advantage of elevated IV on the call side and to have built-in position defense via the short call. This is slightly shorter duration than I like to go (39 DTE), but I also don't have a ton on here, so scrounging around for decent IV underlyings. Cathie also doesn't pay divvies but once a year in December, so there's no point in hanging around in the stock for any period of time. Will generally look to take profit at 50% max on the whole shebang (stock + short call) and/or roll out the short call if it hits 50% max to reduce cost basis further. Metrics: Buying Power Effect/Cost Basis In Stock/Break Even: 43.00/share Max Profit: 1.00 ROC at Max as a Function of Buying Power Effect: 2.33% ROC at 50% Max: 1.16% As previously noted in my other monied covered call posts, this only makes sense in a cash secured environment where you don't get BP relief going short put. On margin, short put will be the most BP efficient. Longby NaughtyPinesUpdated 0
Does ARK Innovation Have Downside Risk?The ARK Innovation ETF has chopped in a range for the last two years, and some traders may expect a push back to longer-term lows. The first pattern on today’s chart is the rounded top in February and March. It was slightly below the peak of December 2023. The lower monthly high may suggest bears remain in control over the longer term. A sharp drop in early April followed the topping pattern. That may add to the possibility of sellers taking control. Second, Wednesday’s bounce retraced about half the decline. A lower high at this spot could confirm a downward move has begun. Prices also stalled at the February 5 low. Has old support become new resistance? Next, ARKK is back below its 200-day simple moving average. Finally, MACD has been falling. Standardized Performances for ETF mentioned above: ARK Innovation ETF (ARKK): 1-year: +24.2% 5-years: +1.97% Since Inception: +11.35% (As of March 28, 2024) Performance data shown reflects past performance and is no guarantee of future performance. The information provided is not meant to predict or project the performance of a specific investment or investment strategy and current performance may be lower or higher than the performance data shown. Accordingly, this information should not be relied upon when making an investment decision. Exchange Traded Funds (“ETFs”) are subject to management fees and other expenses. Before making investment decisions, investors should carefully read information found in the prospectus or summary prospectus, if available, including investment objectives, risks, charges, and expenses. Click here to find the prospectus. TradeStation has, for decades, advanced the trading industry, providing access to stocks, options and futures. See our Overview for more. Past performance, whether actual or indicated by historical tests of strategies, is no guarantee of future performance or success. There is a possibility that you may sustain a loss equal to or greater than your entire investment regardless of which asset class you trade (equities, options or futures); therefore, you should not invest or risk money that you cannot afford to lose. Online trading is not suitable for all investors. View the document titled Characteristics and Risks of Standardized Options at www.TradeStation.com . Before trading any asset class, customers must read the relevant risk disclosure statements on www.TradeStation.com . System access and trade placement and execution may be delayed or fail due to market volatility and volume, quote delays, system and software errors, Internet traffic, outages and other factors. Securities and futures trading is offered to self-directed customers by TradeStation Securities, Inc., a broker-dealer registered with the Securities and Exchange Commission and a futures commission merchant licensed with the Commodity Futures Trading Commission). TradeStation Securities is a member of the Financial Industry Regulatory Authority, the National Futures Association, and a number of exchanges. TradeStation Securities, Inc. and TradeStation Technologies, Inc. are each wholly owned subsidiaries of TradeStation Group, Inc., both operating, and providing products and services, under the TradeStation brand and trademark. When applying for, or purchasing, accounts, subscriptions, products and services, it is important that you know which company you will be dealing with. Visit www.TradeStation.com for further important information explaining what this means.by TradeStation5
ARKK Elliot Wave ABC CorrectionARKK started its rally in November 2023 and reached $54.52 in December 2023. Since this date, according to Elliot Wave Analysis, it may be making an ABC correction. ARKK, which made the A wave by falling to $ 44.63, then rallied to $52.06 with the B corrective wave. As long as ARKK stays below $52.06, ARKK may be making wave C. At the end of this movement, it may fall between $40.35 and $42.59. Shortby selmanduatepeUpdated 0
📊 ARK Innovation ETF Going Down➖ On the 26-Dec session we have an inverted hammer candlestick pattern to signal the top of a trend. This inverted hammer is followed by four weeks red; Inverted hammer as reversal signal confirmed. ARKK produced an upper wick this week, now trades red. ➖ The action moved below EMA100, mid-term bearish potential confirmed. Multiple bearish signals confirmed. We can expect lower for this ETF, easily. Namaste.Shortby AlanSantanaUpdated 228
ARKK Is this the right time to buy 'Innovation'?Ark Innovation ETF (ARKK) hit today its 1D MA200 (orange trend-line) for the first time since the November 13 2023 bullish break-out. This puts the price in the middle of the long-term Channel Up pattern that started on the December 28 2022 bottom. As long as the price action closes the 1D candles above the 1D MA200, we expect an instant rebound. If it breaks above the 1D MA50 (blue trend-line), then our target will be 66.00 (+47.67%, which is the shortest rally it has had within the Channel Up. A closing below the 1D MA200 though should go for at least a -23.34% decline from the top, which will be our buy entry for the long-term, but our Target will be modified to 61.50. ------------------------------------------------------------------------------- ** Please LIKE 👍, FOLLOW ✅, SHARE 🙌 and COMMENT ✍ if you enjoy this idea! Also share your ideas and charts in the comments section below! This is best way to keep it relevant, support us, keep the content here free and allow the idea to reach as many people as possible. ** ------------------------------------------------------------------------------- 💸💸💸💸💸💸 👇 👇 👇 👇 👇 👇Longby TradingShot116
$ARKK - Wyckoff Sign of strengthLooking for continued consolidation within this zone above 46, and a retest of the range highs. This would confirm a partial decline and statistically favor a breakout of the range. Id look at this as the sign of strength, as we have diverged from the bear market downtrend, made a new high locally after a second higher low, while maintaining support above a historical inflection zone . Above 55, id look for a pause at 65, and then continuation to 78 for the 1618 extension, and 89-98 for the measured move and equilibrium. Longby TradingNomadic3
Tracking The Footprints of WRB GapsThis is the first in a series of posts on Gaps. Gaps are a sudden supply/demand imbalance that shows up in the price bars of a chart, It's the expansion that comes after a contraction. Gaps will show us a significant area of buyers/sellers that take control and when they lose that control. In the video, I discuss and define a Wide Range Bar (WRB) Gap and show how to mark it out on a chart. A WRB Gap is a bar larger than the last 3 bars with a space between the previous bar and the subsequent bar. We will be marking the base of the gap. If it's an up Gap, mark out the bottom 1/3 of the bar, if it's a down gap, mark out the upper 1/3 of the bar. We can then make observations about how price interacts with the base of this gap when or if it gets there. Then begin to notice where in the swing process the Gap is happening. Don't make conclusions, just observe and learn. There are many ways to trade Gaps but first, we must first lay out some foundations and then come up with objective ways to see them. For now, simply look for the biggest ugliest bars on your chart and mark them out and observe. These are footprints that we can follow and track. ShaneEducation12:19by ShaneBlankenshipUpdated 2211