ARKK: when a breakout isn’t just a breakout-it’s a runway to $91On the weekly chart, ARKK has broken out of a long-standing ascending channel, ending a year-long consolidation phase. The breakout above $71.40, with a confident close and rising volume, signals a transition from accumulation to expansion. The move came right after a golden cross (MA50 crossing MA200), further confirming institutional interest. Price has already cleared the 0.5 and 0.618 Fibonacci retracements — and the 1.618 extension points to $91.40 as the next technical target.
Momentum indicators like MACD and stochastic remain bullish with room to run. Volume profile shows low supply above $75, which could fuel an acceleration toward the target zone.
Fundamentally, ARKK remains a high-beta, high-risk vehicle — but one with focus. The ETF is positioned around next-gen tech: AI, robotics, biotech, and automation. Assets under management now exceed $9.3B with +$1.1B net inflow in 2025. YTD return stands at 37%, and its top holdings (TSLA, NVDA, COIN) are back in favor. This isn’t just a bet on innovation — it’s diversified exposure to a full-blown tech rally.
Tactical setup:
— Entry: market $69.50 or on retest
— Target: $80.21 (1.272), $91.40 (1.618 Fibo)
Sometimes a breakout is just technical. But when there’s volume, a golden cross, and billions backing it — it’s a signal to buckle up.
ARKK trade ideas
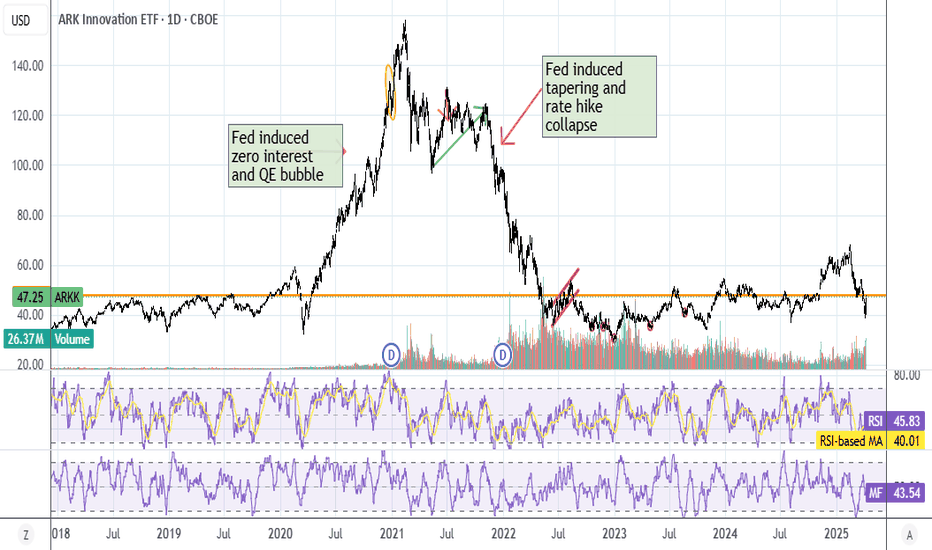
Cathie Wood Sucks ARKKI always like to mock Cathie, so just throwing up a plot for fun. Orange line is today's close after a 10% market day. If you invested in ARKK in 2018, congrats, you broke even today, lol.
She got a reputation from picking a bunch of speculative stocks during the COVID days, you can see the performance since just plain out sucks. 12% of her holdings is still in TSLA, lol. ARKK also owns 10% of PD float (as in 10% of the whole company). She singlehandedly pumped PD during COVID, and now she's stuck with that, there's no liquidity.
The worst part about this? If you had invested in TSLA instead of ARKK in 2018, you'd be up 10x right now. 4X if you bought AAPL. Why even bother with this fund?
Note: No position, just hate listening to her pump TSLA all the time, $2600 in 5 years, lol.


