Cathie Wood (ARKK) looks promising - H&S BreakoutARKK Innovation Fund is looking to test neckline. Break should set it free for 71 where we have some resistance. Yields are going lower and momentum is returning with growth stocks. Longby KemsdaleUpdated 223
ARK Innovation ETFAs we expect a bull run in 2024, ARK Fund ETFs tend to perform pretty well during this period. November saw a significant increase in volume with the ETF rallying 31.44%. This can be a sign of a bottom with the possibility of higher lows going forward. Some of the stocks in this ETF are underperforming, thus, putting pressure on the price. But when the market is hot, the tide rises all boats. Longby Candles2540
ARKKARKK: couldnt hold support 45 and continued to slide down till next support zone. While daily buy signals are present, a weekly buy signal has not yet emerged. This suggests the possibility of a short-term bounce from this point before a potential further decline in September. The critical levels of support for bulls stands at $38 (0.786 fib) and 35 (stronger) which will validate the impulsive wave count.Longby Babyshark_zzzUpdated 1
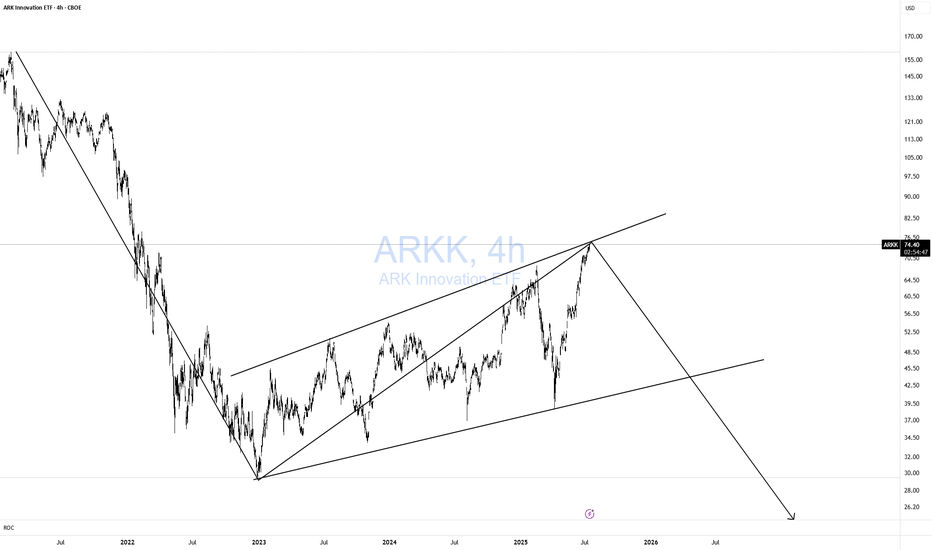
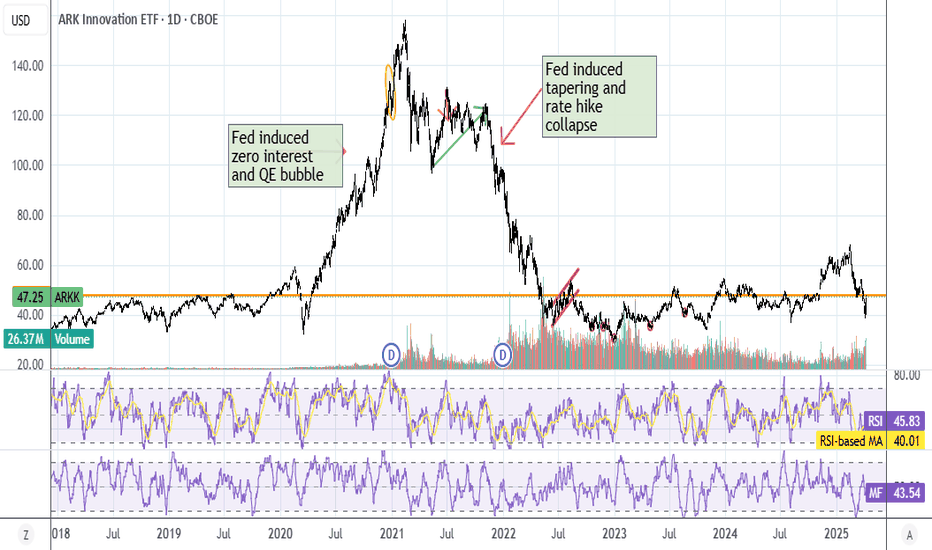
ARK bubble burstingIt looks like the ARK ETF has created a classical Wall street market cycle, so as follows, this is the macro outlook. EnjoyShortby zyberalUpdated 4411
ARK Innovation ETF ($ARKK) Approaches Double Top ### Stock Market Update: ARK Innovation ETF ( AMEX:ARKK ) Approaches Critical Double Top #### Key Technical Level for AMEX:ARKK The ARK Innovation ETF ( AMEX:ARKK ) has reached a pivotal point on its chart, forming a Double Top pattern at $45.16. This pattern is a crucial indicator in technical analysis, often signaling a potential turning point in the stock's trajectory. #### Strategy for Long Positions For those currently holding long positions in AMEX:ARKK , this level presents a strategic opportunity to take profits. As the ETF approaches this significant double top formation, realizing gains at this juncture can be a prudent move, considering the potential for a trend reversal implied by the pattern. #### Guidance for Short Sellers For investors specializing in short-selling, the approach requires a bit more caution. If considering a short position in AMEX:ARKK , it's advisable to wait for a clear indication that the stock is responding to the double top formation. This could be a pierce through the $45.16 level or even a definitive break below it. However, a key tactic is to observe the stock's behavior over the following two trading days. Entering a short position is ideally done after witnessing two consecutive days of downwardby AlgoTradeAlert2
$ARKK Inverse Head & Shoulders PatternThe ARK Innovation ETF ( AMEX:ARKK ) is currently displaying an inverse head and shoulders pattern on its chart, a formation typically indicative of a potential bullish reversal. However, for this pattern to remain valid, it's crucial that AMEX:ARKK does not close below the key level of $34.72 on a weekly basis. A weekly close below this price point would invalidate the pattern, suggesting a potential shift or continuation of the bearish trend.by AlgoTradeAlert1
$ARKK: Another Dip Through 40I'm curious if in the short term ARKK may underperform at the 40 handle. I believe some growth names like DASH, DOCU and SNOW may have gotten ahead of themselves and are worthy of another pullback at least for now..best of luck tradersShortby Fox_Technicals0
Updated Portfolio: Growth, Momentum & InnovationHere is the link to our updated portfolio which has been up by > 12% last week: www.tradingview.com META is a new stock in our portfolio. A 5.8% position has been added today. Selection Criteria: Introducing our cutting-edge trading strategy, a synergy of Cathy Wood's keen fundamental analysis and Mark Minervini's acclaimed trend template criteria. Imagine having the foresight to identify high-potential technology stocks that are not just promising on paper but are actively demonstrating robust performance in the market. That's the core of our approach. We meticulously select stocks that Cathy Wood's methodology identifies as leaders in technological innovation, ensuring that each company has a solid foundation for growth. But we don't stop there. We apply Mark Minervini's trend template to verify that these stocks are not only fundamentally sound but are also in a confirmed stage 2 uptrend. This dual-layered strategy ensures that you're investing in companies that are both revolutionizing their industries and are currently capturing the market's momentum. With our trading strategy, you're not just betting on potential; you're investing in technology stocks that are set to soar, backed by the analytical prowess of two of the most respected names in the trading world. Join us, and be part of a select group of traders who demand the best of both worlds: groundbreaking innovation and proven market trends. Longby JS_TechTrading2
$ARKK Bullish Consolidation Up NextARKK is currently in a bullish consolidation pattern, which is expected to continue for about 4-5 days. A breakout from this pattern is likely to occur on November 13th or 14th.Longby AlgoTradeAlert112
Updated WatchlistHere is the link to our updated watchlist: www.tradingview.com Following the trading methodologies of Mark Minervini and Cathy Wood. Our trading strategy combines the best of both world's: Stock selection is based on Cathy Woods fundamental analysis for high potential technology stocks which are already in a confirmed stage 2 uptrend according to Minervini's trend template criteria.Longby JS_TechTrading0
$ARKK Bearish Parallel Downtrend BreakAMEX:ARKK Technical Analysis: The chart showcases a definitive break from its bearish parallel downtrend. Key resistance is observed at the purple delineation. For bullish sentiment to prevail, it would be essential to witness consolidation patterns such as a bull flag. Conversely, for the bears to maintain dominance, a rejection from the purple line followed by a bearish consolidation pattern, like a bear flag, would be indicative.by AlgoTradeAlert3
Cathie Wood's Trading MethodologyUnderstanding Cathie Wood's Trading Methodology 1. Introduction In the dynamic world of finance, few have garnered as much attention in recent years as Cathie Wood, the visionary founder and CEO of ARK Investment Management. Underpinning her meteoric rise is a trading methodology that champions disruptive innovation and a futuristic outlook. Let's dive deep into what makes Wood's strategies stand out. 2. Historical Context Investment, for decades, thrived on the mantra of 'safety first.' Blue-chip stocks, steady dividends, and bonds defined portfolios. However, the digital revolution brought with it companies that didn’t fit the traditional mold. Here, Wood saw an opportunity, challenging traditional norms and adopting an approach anchored in tomorrow rather than yesterday. 3. Disruptive Innovation as the Core At the heart of ARK's investment strategy lies disruptive innovation. These are technologies or business models that transform industries and often render old methods obsolete. Think about how streaming altered entertainment or how electric vehicles (EVs) are reshaping mobility. In these disruptions, Wood sees not just change but investment opportunities. 4. Research-Driven Approach While many firms tout the depth of their research, ARK goes a step further. It actively bridges the gap between sectors, combining insights from tech, healthcare, energy, and finance. The firm even collaborates with academia, startups, and online communities, believing that understanding disruption requires diverse perspectives. 5. Active Management and Portfolio Construction Passive investing, tracking indices, has its merits, but Wood's vision is anything but passive. ARK's active management is about agility. As new research insights emerge or market dynamics shift, ARK's portfolios evolve, ensuring they reflect the most promising opportunities in disruptive sectors. 6. Contrarian Views and High Conviction Bets Wood has never shied away from making bold claims, be it her bullish price target for Tesla or her belief in Bitcoin's potential. These high conviction bets might seem risky, but for Wood and ARK, they're informed decisions, grounded in research and a genuine belief in a company's or technology's transformative potential. 7. Exit Strategies and Risk Management Every investment strategy, no matter how bullish, requires an exit plan. ARK's exit strategies, while not always publicized, are undoubtedly rooted in their rigorous research. Changes in a company's fundamentals, regulatory landscapes, or unexpected industry shifts can all trigger an exit. Additionally, risk is actively managed, with diversification strategies and hedging to cushion potential downturns. 8. Transparency and Engagement with the Public A distinctive hallmark of ARK is its commitment to transparency. Unlike many peers, ARK frequently publishes its research, trades, and theses. This openness invites both praise and scrutiny, fostering a two-way dialogue between ARK and the investor community. 9. Criticisms and Challenges No strategy is beyond critique. Wood's high conviction bets, while often profitable, expose portfolios to potential volatility. Detractors also argue that her strategies are too growth-focused, potentially overlooking stable, value-driven opportunities. Furthermore, ARK's rapid ascent means it now manages a sizable asset pool, which brings with it challenges of scale and agility. 10. Key Takeaways Cathie Wood's vision extends beyond current market trends, anchoring firmly in future possibilities. ARK's interdisciplinary research approach offers a holistic perspective on disruption. Active portfolio management ensures adaptability in a fluid market landscape. Transparency, while a double-edged sword, sets ARK apart, fostering trust and facilitating informed discourse. 11. Conclusion In an era defined by rapid technological evolution, Cathie Wood's forward-looking trading methodology offers a refreshing perspective on investment. While not without its challenges, her approach underscores the importance of adaptability, conviction, and a keen understanding of the interplay between technology and industry. As the line between tech and traditional sectors blurs, methodologies like Wood's are not just relevant but imperative.Educationby JS_TechTrading1
ARKK - Even garbage floats in a rising tideCPI next Thu is supposed to come in pretty low. Guessing this is the bottom for Cathie's collection of garbage stocks as the tide come in next week. Garbage rises with the tide, because most garbage is plastic, lol. (Cathie's garbage is oversold, look at the indicators.) by hungry_hippoUpdated 6
ARKK ARK Innovation ETFI'm sorry but nothing excites me about this chart. Buy sell volume is obvious too.by BradWeber820
SHORT ARKKprice breakdown. fibonacci shows a price target of $18. Cathy wood is selling a dream. Shortby RogueCleaner0
Cathy Woods ARKK ETF: Technical Analysis & AdviceDetailed Technical Analysis: Price Action: Support & Resistance: After its peak in early 2023, ARKK found support near the 37.50 USD range. This could serve as a significant support level. On the resistance side, the 42.50 USD level, which was previously support in mid-2023, may now act as a resistance. Trend: Currently, the trend is bearish, indicated by consistent lower highs and lower lows. Moving Averages: The fact that the stock is trading below its 50, 150, and 200-day moving averages solidifies the bearish sentiment in both short and longer time frames. A bullish sign would be if the stock can break and hold above these averages. Bollinger Bands: The ETF is trading near the lower Bollinger Band. This proximity usually suggests an oversold condition, and there could be a potential bounce back to the middle band (which is also the 20-day MA). Fibonacci Levels: The stock seems to be hovering near the 0.618 Fibonacci retracement level. This is known as the 'golden ratio' and is often watched by traders for potential reversals. If the ETF cannot hold this level, the next key Fibonacci level would be the 0.786. RSI (Relative Strength Index): The RSI near 35 suggests that the ETF is close to the oversold territory. If it dips below 30 and then starts to rise, this could be a bullish divergence signal, hinting at a potential reversal. MACD: The MACD line being below the signal line and both being in negative territory is bearish. However, if the MACD starts to curve upwards and crosses above the signal line, it would be a bullish crossover, indicating potential upward momentum. Stochastic Oscillator: Currently nearing the oversold region, a bullish sign would be if the %K line crosses above the %D line within or above the oversold territory. Volume: While the stock has been declining, the volume doesn't show a significant increase. This could mean that there isn't a massive selling pressure, and the decline might be more due to a lack of buyers than an influx of sellers. Trading Advice: Considering the current bearish sentiment but the proximity to potential oversold conditions, here's a suggested approach: For Bullish Traders: Wait for confirmation signals like the RSI moving back above 30, a MACD bullish crossover, or the stock bouncing off the 0.618 Fibonacci level. If these occur, consider entering a long position with a stop-loss below the recent lows. For Bearish Traders: If the ETF breaks below the 0.618 Fibonacci level and shows increased selling volume, there might be further downside. Consider entering a short position with a stop-loss above the recent highs or the nearest resistance. For Neutral Traders: If unsure, it might be best to wait on the sidelines until a clearer trend emerges. Remember, while technical analysis can provide insights and potential strategies, there's always inherent risk in trading. It's crucial to combine this with fundamental analysis, keep updated with relevant news, and only invest what you're willing to lose. by JS_TechTrading1
Arkk Bottom Today or next week, think it could be very closeI'm getting the same vibes Gold did when it had a fake breakdown which is now very bullish. Everyone on the timeline is making fun of Cathy and saying how bad Arkk is, it's all over the place. Think this lines up with the charts. $29 ish should be an amazing confluence for a major bottom. I think we will get a fake breakdown of the March 2020 lows which will be very bullish. Longby ghengiskahnspermshotUpdated 110
bearish bat pattern $53.50 target needs to close above .382 fiblooking at ARKK I see a bearish bat pattern forming to $53.50, the 1.618 fib level is at 69 near a gap fill which is another supply zone.. If the market continues upward, I anticipate ARKK to fill the gap and supply zone. Price action needs to close above the .382 fib level... I will update accordingly Longby moneyflow_traderUpdated 4412
Cathie's sinking ship, ARKKI keep saying Cathie's a moron, for some reason people keep interviewing her, lol. Anyways daily RSI hit oversold, but the major holdings like TSLA, ROKU, COIN, and ZM haven't so this has a lot more room to go down. Plus she's got such a huge chunk of garbage companies like PD that she doesn't have an exit plan. She actually thinks TSLA is headed to $2k, lol. TSLA would need 100% market share of the entire world auto market to achieve that. This ETF is showing the same exact chart pattern as last year since June. Dump it.by hungry_hippo335
$ARKK is reversing higherAMEX:ARKK now needs a break above 45 for an extension higher after the long-term falling trend line break. Invalidation of the upside extension can only come if we see a break below 40by ewaction1
ARKK looking like a botommI might be late, but not too late. ARKK has been flirting with the PoC from the top and forming some kind of complex inverse head and shoulders. Innovation and growth have taken a hit in a big way over the last year and a half, but this is looking like an opp. to bid on innovative growth returning at some point. I'm skeptical of Cathie's leadership in this etf, but the chart setup looks appealing. Longby CryptoParadyme0
Oh Cathy, My CathyI miss Robin Williams' brilliance. 200-500 daily so long as Cathy can hold above 39. Targets as marked. Stop say trailing 2.00.by gkmUpdated 4
ARK Innovation Support Area to Watch for BounceHi Guys! This is a Technical Analysis on ARK Innovations ETF (ARKK) on the 1 Week Timeframe. Jumping right in: Our current Price action is currently bouncing off a Confluence of SUPPORT Test We tested this Confluence of Support area the prior 2 weeks. The Confluence involves: 1. 50 SMA 2. Support Line of the Uptrend Channel This would make an area to go LONG. We are currently in the process of testing RESISTANCE from 21 EMA Since this is one the 1 Week timeframe, we need to observe how this weeks candle interacts with the 21 EMA. If we can close ABOVE, at the end of the week. That would be a good sign. NOTE: If we can confirm SUPPORT on 21 EMA, this is a bullish sign. Since UPTRENDS are associated with being ABOVE the 21 EMA It would hint at or strengthen the probability we move towards the Horizontal "Resistance Line" Above in Red. This would also be an area to TAKE PROFIT. BUT my main focus for ARKK would be to BREAK Above and CONFIRM Support over the MAJOR Resistance Line in Orange. Once we do that, we have CHANGED our MAJOR TREND. Though we have a long ways to go, keep in mind that when this happens, itll be a CRUCIAL AREA to watch. Since we havent had 3 touch points, we could be rejected which could make it a short play also. Now since i believe we must always be prepared. Lets look at the downside, if we can't maintain this current SUPPORT area. My first downside target would be the line titled "Support Line#1 My 2nd downside target would be the line titled "Support Line#2 To find more evidence of whats to come, i look at the current indicators placed. STOCH RSI, is currently BELOW the 20 level. A BULLISH CROSS, where Blue line is above Orange ABOVE the 20 elvel, would indicate Bullish momentum coming in. This would help push prices towards Resistance Line. Notice also RSI, particularly the Black line. We were for a short time, below this line but currently attempting to move back ABOVE. If we can maintain SUPPORT on this, our trend would be intacted. Which would support UPTREND. Finally the MACD, we need to watch this one closely. We have crossed BEARISH. We need to see a Bullish Cross and maintain staying ABOVE the 0 level. If we do this, i can eventually see ARKK move towards the "MAJOR Resistance line". __________________________________________________________________________________ Thank you for taking the time to read my analysis. Hope it helped keep you informed. Please do support my ideas by boosting, following me and commenting. Thanks again. Stay tuned for more updates on ARKK in the near future. If you have any questions, do reach out. Thank you again. DISCLAIMER: This is not financial advice, i am not a financial advisor. The thoughts expressed in the posts are my opinion and for educational purposes. Do not use my ideas for the basis of your trading strategy, make sure to work out your own strategy and when trading always spend majority of your time on risk management strategy Longby SafofAllTrades0