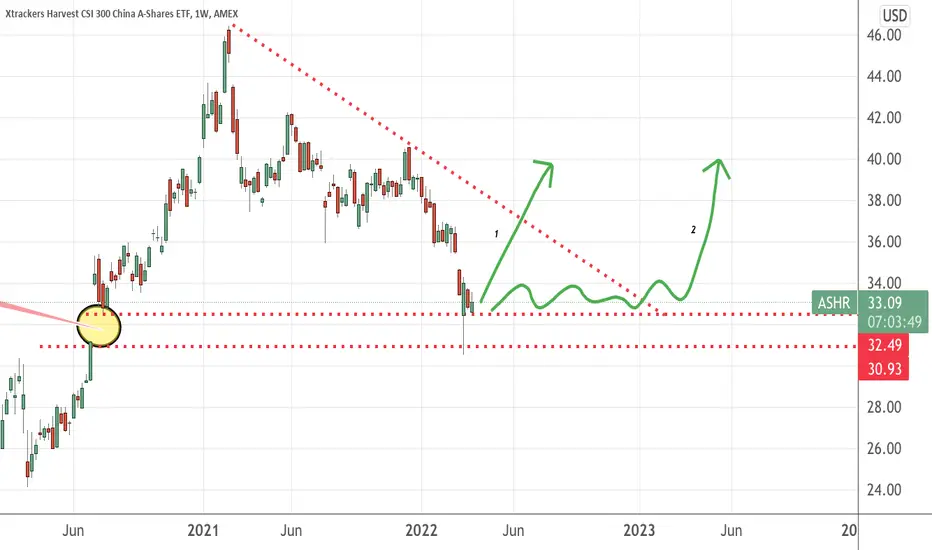
CHINA: LONG-TERM SUPPORT BECOMES RESISTANCEA Long-term Symmetrical Triangle has influenced Chinese stock prices for decades. Breakouts have shown predictable price moves. We are now seeing the first Breakdown.
- 10-Year Support became Resistance earlier this year.
- A lower, parallel, 5-Year Support has broken down and looks to become Resistance as well.
If this downtrend continues, new all-time lows are probable.
ASHR trade ideas

A good time to get exposed to the China market Read more about this ETF here
Take a look at the gap being filled and I expect the price to be consolidating for a while more , probably Q3 onwards, we can see some rally ahead.
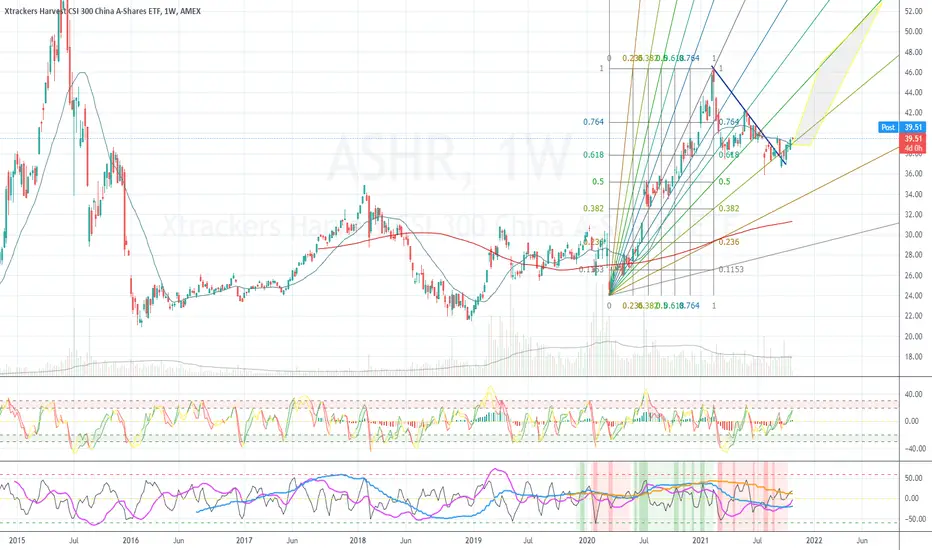
Chinese SSE300 Index ETF: Bearish Dragon with 1.618 TargetThis is an extension to the Bearish SSE50 setup that I posted not so long ago; I found a tradable US Listed ETF that tracks the movement of the SSE300 and the situation on this chart is pretty much the same as the one for the SSE50 where we are breaking a logarithmic trendline, the moving averages, and looking to make a minimum 61.8% retrace. However, I believe it will go much deeper and my targets will be the 88.6% retrace at $17.31 and then the 1.618 Fibonacci Extension below at $7.72

ASHR (also EEM, CQQQ, MCHI) Longer Term BullishI bought ASHR, but all these Chinese related names look like they are building a base to move higher from. I'd like to see it try to maintain the 20MA as some support, but if it doesn't, it's not a deal breaker.
EEM has the best options, so I might be adding something from that eventually.
"Panda Bear" coming out to playThis is straight from my meditation. I was trying to ask about the market and getting distracted, but as soon as I came back to quiet, I received, "panda bear". I thought maybe it's a company or mascot until I actually googled it.
This is in alignment with a LITERAL bear that visited a cabin we were at last week (never seen that before), and then my trading friend suggested it could be a sign of a bear market. I asked for a sign giving confirmation indexes might go down soon, and was amazed I received it within an hour.
A new virus out of China may be the catalyst and I'm sure governments would like nothing more than to keep people in fear. Please don't pander to them!
My dowsing suggests a longer term downtrend. I'll update with a target.
US indexes may pop today, but I'll do a separate post if I do some work on them, specifically SPY or /ES.

ASHRStill keeping the uptrend line has said enough.
Hopefully next rally can give it enough cushion for second leg down.

Add quite a bit ASHR hereASHR is testing upper BB on weekly and CN1 is testing long term support.
Added ITM short term weeklies and longer term OTM calls.
Risky. May need to get rid in near term depending on price movement.
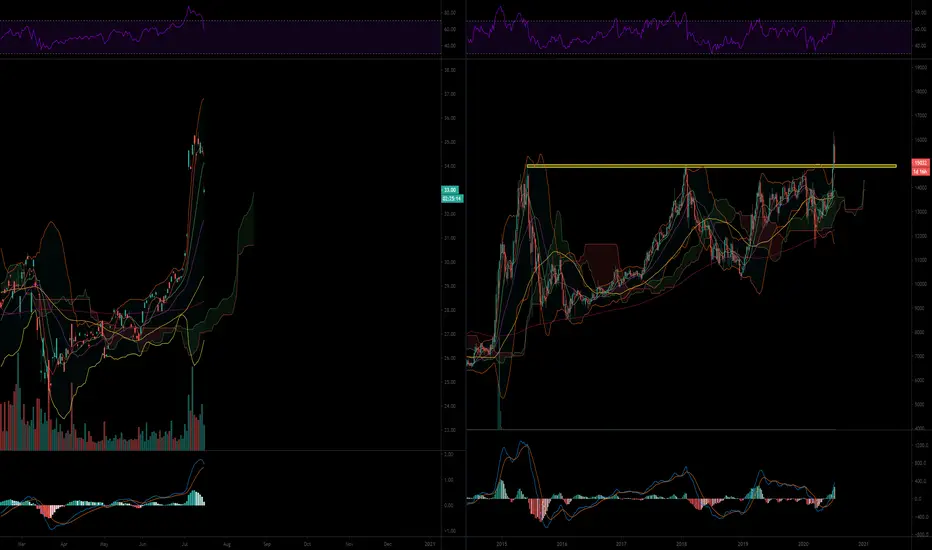

ASHR strong breakoutThis one is more longer term and could be a BTFD play in the coming weeks/months. Would be one of my major play for the remainder of the year as long as the yellow area in relative performance chart is hold.
Fundamentally, it is more of play who will recover first from COVID-19.
Weekly volume is picking up but not at extreme yet. To me that means more upside is coming.


Use $ASHR to Play ShanghaiASHR ETF provides a good vehicle for trading and tracking the Shanghai stock market as China suffers through the coronavirus during its New Year market holiday.

ASHR- LONGMACD cross and staying above the 200 MA. Looking for it to increase to the fibonacci ext levels. Resistance at 29. Short term looking for $30.81


THE WEEK AHEAD: HAND SIT ON PREMIUM SELLINGAlthough VIX finished the week above the low volatility environment zone (<15) at 16.48, not much is enticing here from a premium selling standpoint at first glance. Earnings announcements are now down to a trickle, with the next quarter's announcements coming into range in the May cycle, militating in favor of putting on earnings-related volatility contraction plays closer to announcement since implied will in all likelihood expand running into them.
ASHR (50/29), GDXJ (44/27), GDX (35/24), TLT (36/10), XLB (33/19) round out the top five exchange-traded funds sorted by rank; EWZ (12/38), XOP (26/32), OIH (27/32), ASHR (50/29), and USO (14/28) when sorted by 30-day implied, all below the >50/35 metrics I like to see out of these to put plays on, although I will continue to sell a bit of XOP premium here, since it's 30-day implied is nearly twice that of SPY's at the moment: the May 17th 30 short straddle's paying 2.99 (.75 at 25% max), nearly 10% of the Friday close share price of 30.06.
On the majors end of the stick: SPY (28/16), QQQ (23/20), DIA (22/17), and IWM (19/21) -- all at the low end of their 52-week volatility ranges.


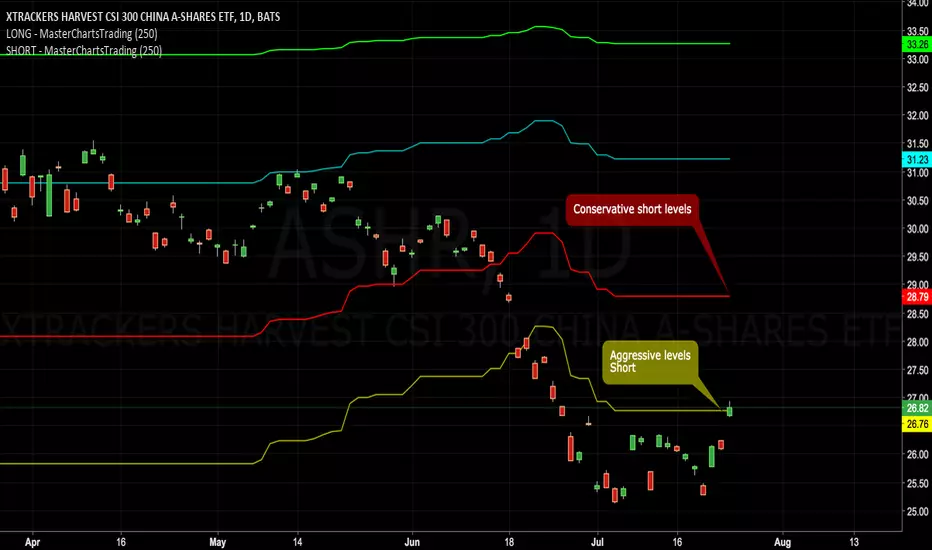
China Stocks Should Be Shorted: Specific Level to Watch#China #Stocks Should Be Shorted: Specific Level to Watch $FXI #trading
Put these support resistance indicator lines on your chart!
Indicators show decent places to enter or exit.
The Blue indicator line serves as a Bullish Trend setter.
If your instrument closes above the Blue line, we think about going Long.
For commodities and Forex, when your trading instrument closes below the Red line, we think about Shorting.
For Stocks, I prefer to use the Yellow line as my Bearish Trend setter (on Daily charts).
Find out more! Send Private Mail (PM) to @MasterCharts
ASHR monthly - looks like an early bull - 7/26/2017China currently has a lot problems for sure. But stock market is a discounting and forward looking mechanism. Technically ASHR is in its early bull run.


ASHR monthly - might be on the verge of breaking outIt needs to go above previous high which is $26.14 before anything else. Visually the moving average rainbow is tightening, which indicates the start of a big move is coming.
