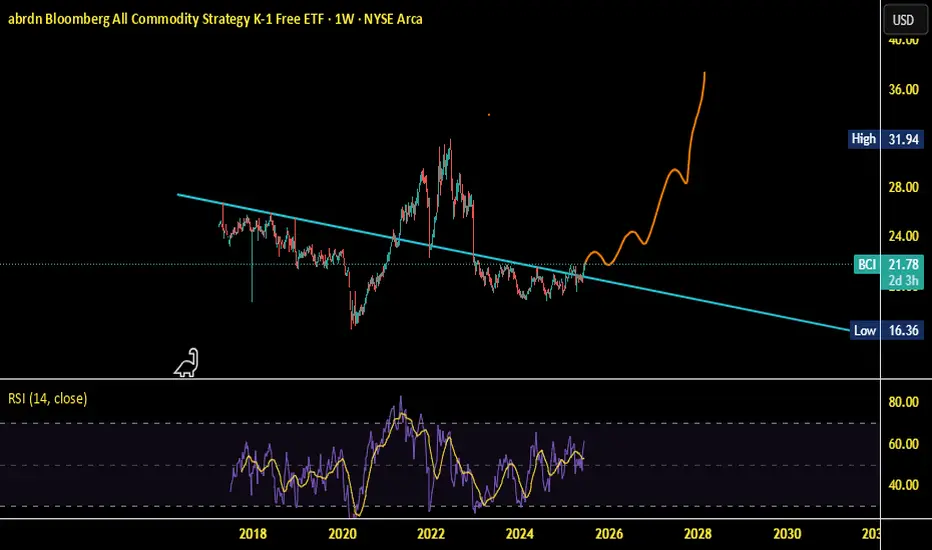
BCI Commodities Bull CycleThere is a strong supply line that is being broken by the chart, above this line there appears to be high volatility, which is also matching up with tensions in the Middle East in regards to Crude prices. Perhaps the move is equities to commodities soon.
Key stats
About abrdn Bloomberg All Commodity Strategy K-1 Free ETF
Home page
Inception date
Mar 30, 2017
Structure
Open-Ended Fund
Replication method
Synthetic
Dividend treatment
Distributes
Distribution tax treatment
Ordinary income
Income tax type
Capital Gains
Max ST capital gains rate
39.60%
Max LT capital gains rate
20.00%
Primary advisor
abrdn, Inc.
Distributor
ALPS Distributors, Inc.
BCI is tracks a highly liquid, broad indexthe Bloomberg Commodity Indexcombined with the return of 3-month T-bills. The index includes up to 25 commodity futures contracts in the agriculture, energy, livestock, and metals sectors. Futures positions are weighted 2/3 by trading volume and 1/3 by world production. The index rebalances each January with weight-caps applied at the sector level. Contract tenor selection is determined by a set roll schedule that varies by commodity. The fund manages its commodity exposure through a wholly owned Cayman Islands subsidiary, a common structure in the commodity ETF space.
Related funds
Classification
What's in the fund
Exposure type
Government
Miscellaneous
Bonds, Cash & Other100.00%
Government76.42%
Miscellaneous16.98%
Cash6.60%
Top 10 holdings
Commodities, Equities and the Everything BubbleIn 5 years:
If equities are in a bear market
and
Bonds are in a bear market
and
Cash is no longer king
I wonder if people will start valuing "real stuff" more than "paper stuff"?
We are about to find out together :)

BCI potential pattern developmentI bought into BCI this year as an inflation hedge and a play on the potential start of a long-term commodities upswing. However, I am generally skeptical of the asset class overall simply because commodities tend to have prolonged down cycles where they drag down the rest of the portfolio and since

See all ideas
Summarizing what the indicators are suggesting.
Oscillators
Neutral
SellBuy
Strong sellStrong buy
Strong sellSellNeutralBuyStrong buy
Oscillators
Neutral
SellBuy
Strong sellStrong buy
Strong sellSellNeutralBuyStrong buy
Summary
Neutral
SellBuy
Strong sellStrong buy
Strong sellSellNeutralBuyStrong buy
Summary
Neutral
SellBuy
Strong sellStrong buy
Strong sellSellNeutralBuyStrong buy
Summary
Neutral
SellBuy
Strong sellStrong buy
Strong sellSellNeutralBuyStrong buy
Moving Averages
Neutral
SellBuy
Strong sellStrong buy
Strong sellSellNeutralBuyStrong buy
Moving Averages
Neutral
SellBuy
Strong sellStrong buy
Strong sellSellNeutralBuyStrong buy
Displays a symbol's price movements over previous years to identify recurring trends.
Frequently Asked Questions
An exchange-traded fund (ETF) is a collection of assets (stocks, bonds, commodities, etc.) that track an underlying index and can be bought on an exchange like individual stocks.
BCI trades at 20.55 USD today, its price has fallen −0.44% in the past 24 hours. Track more dynamics on BCI price chart.
BCI net asset value is 20.53 today — it's fallen 1.16% over the past month. NAV represents the total value of the fund's assets less liabilities and serves as a gauge of the fund's performance.
BCI assets under management is 1.62 B USD. AUM is an important metric as it reflects the fund's size and can serve as a gauge of how successful the fund is in attracting investors, which, in its turn, can influence decision-making.
BCI price has fallen by −1.34% over the last month, and its yearly performance shows a 4.74% increase. See more dynamics on BCI price chart.
NAV returns, another gauge of an ETF dynamics, have risen by −1.16% over the last month, have fallen by −1.16% over the last month, showed a 0.14% increase in three-month performance and has increased by 8.81% in a year.
NAV returns, another gauge of an ETF dynamics, have risen by −1.16% over the last month, have fallen by −1.16% over the last month, showed a 0.14% increase in three-month performance and has increased by 8.81% in a year.
BCI fund flows account for 545.41 M USD (1 year). Many traders use this metric to get insight into investors' sentiment and evaluate whether it's time to buy or sell the fund.
Since ETFs work like an individual stock, they can be bought and sold on exchanges (e.g. NASDAQ, NYSE, EURONEXT). As it happens with stocks, you need to select a brokerage to access trading. Explore our list of available brokers to find the one to help execute your strategies. Don't forget to do your research before getting to trading. Explore ETFs metrics in our ETF screener to find a reliable opportunity.
BCI invests in bonds. See more details in our Analysis section.
BCI expense ratio is 0.26%. It's an important metric for helping traders understand the fund's operating costs relative to assets and how expensive it would be to hold the fund.
No, BCI isn't leveraged, meaning it doesn't use borrowings or financial derivatives to magnify the performance of the underlying assets or index it follows.
In some ways, ETFs are safe investments, but in a broader sense, they're not safer than any other asset, so it's crucial to analyze a fund before investing. But if your research gives a vague answer, you can always refer to technical analysis.
Today, BCI technical analysis shows the strong sell rating and its 1-week rating is sell. Since market conditions are prone to changes, it's worth looking a bit further into the future — according to the 1-month rating BCI shows the neutral signal. See more of BCI technicals for a more comprehensive analysis.
Today, BCI technical analysis shows the strong sell rating and its 1-week rating is sell. Since market conditions are prone to changes, it's worth looking a bit further into the future — according to the 1-month rating BCI shows the neutral signal. See more of BCI technicals for a more comprehensive analysis.
Yes, BCI pays dividends to its holders with the dividend yield of 3.17%.
BCI trades at a premium (0.08%).
Premium/discount to NAV expresses the difference between the ETF’s price and its NAV value. A positive percentage indicates a premium, meaning the ETF trades at a higher price than the calculated NAV. Conversely, a negative percentage indicates a discount, suggesting the ETF trades at a lower price than NAV.
Premium/discount to NAV expresses the difference between the ETF’s price and its NAV value. A positive percentage indicates a premium, meaning the ETF trades at a higher price than the calculated NAV. Conversely, a negative percentage indicates a discount, suggesting the ETF trades at a lower price than NAV.
BCI shares are issued by Aberdeen Group Plc
BCI follows the Bloomberg Commodity Index. ETFs usually track some benchmark seeking to replicate its performance and guide asset selection and objectives.
The fund started trading on Mar 30, 2017.
The fund's management style is passive, meaning it's aiming to replicate the performance of the underlying index by holding assets in the same proportions as the index. The goal is to match the index's returns.