Added to $COHN Target 31.86 for 44.95%$COHN Target 31.86 for 44.95%
Or next add at 17.50 (1M low)
Let's try this again... since last time my sell order was not set 🤬😬😭
-----
—
On the far right of the chart is my Average (Grey) Current Target (Green), and Next Level to add (Red) Percentage to target is from my average.
ONLY ADD a
−1.14 USD
−129.00 K USD
145.71 M USD
15.49 M
About Cohen & Company Inc.
Sector
Industry
CEO
Lester Raymond Brafman
Website
Headquarters
Philadelphia
Founded
1999
FIGI
BBG000BN06T1
Cohen & Co., Inc. engages in fixed income markets. It operates through the following segments: Capital Markets, Asset Management, and Principal Investing. The Capital Markets segment consists of fixed income sales, trading, matched book repo financing, and new issue placements in corporate and securitized products and advisory services, operating primarily through its subsidiaries. The Asset Management segment manages assets through investment vehicles, such as collateralized debt obligations, managed accounts, and investment funds. The Principal Investing segment includes investments that made for the purpose of earning an investment return. The company was founded in 1999 and is headquartered in Philadelphia, PA.
Related stocks

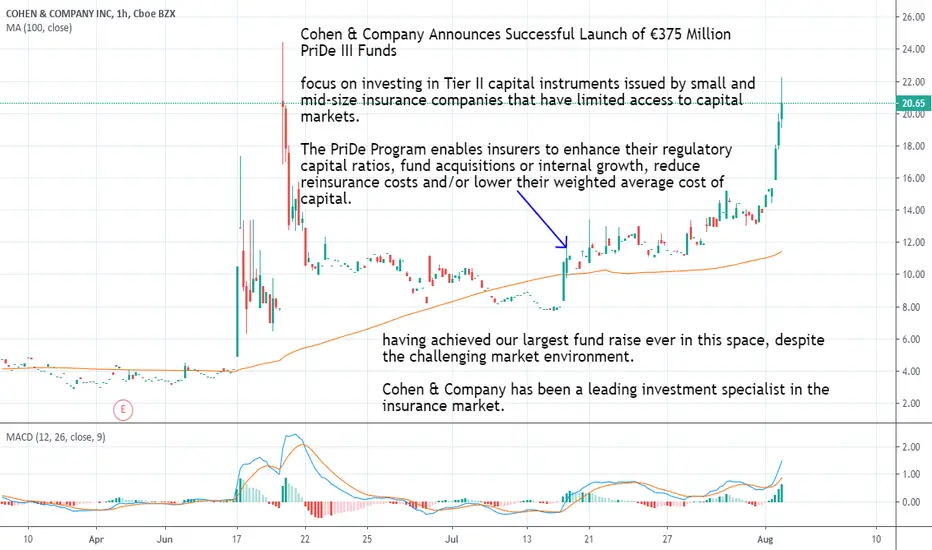
Successful Launch of €375 Million PriDe III FundsCohen & Company Announces Successful Launch of €375 Million PriDe III Funds
focus on investing in Tier II capital instruments issued by small and mid-size insurance companies that have limited access to capital markets.
The PriDe Program enables insurers to enhance their regulatory capital ratios
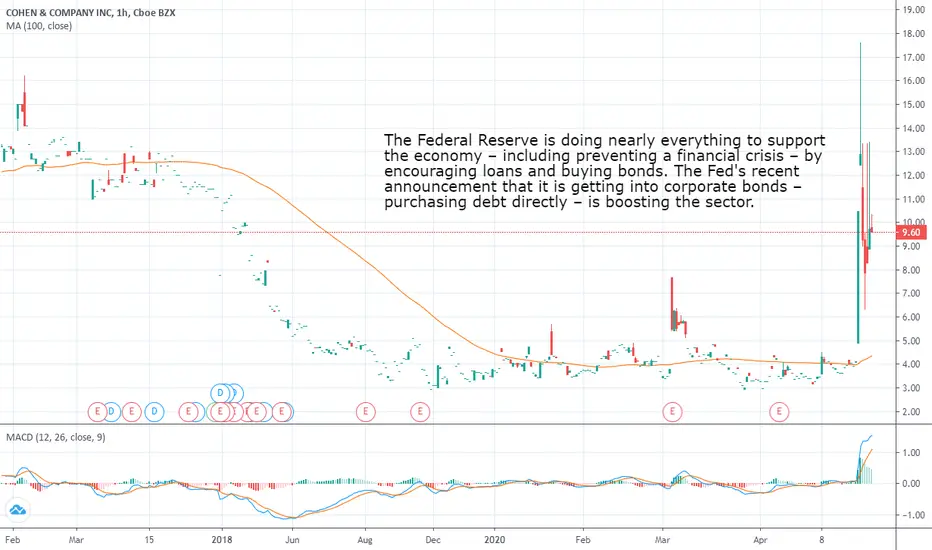
Fed boosting the sector?The Federal Reserve is doing nearly everything to support the economy – including preventing a financial crisis – by encouraging loans and buying bonds. The Fed's recent announcement that it is getting into corporate bonds – purchasing debt directly – is boosting the sector.
This one looks ready to blowLook for either a very fast dump or an insane pump. Big volatility is going to hit this one and using the OBV as an indicator shows massive buys with substantial upside potential.

Alert set for breakout in Cohen & CoCohen & Co., Inc. engages in fixed income markets. It operates through the following segments: Capital Markets, Asset Management, and Principal Investing. The Capital Markets segment consists of fixed income sales, trading, matched book repo financing, and new issue placements in corporate and secur

See all ideas
Summarizing what the indicators are suggesting.
Oscillators
Neutral
SellBuy
Strong sellStrong buy
Strong sellSellNeutralBuyStrong buy
Oscillators
Neutral
SellBuy
Strong sellStrong buy
Strong sellSellNeutralBuyStrong buy
Summary
Neutral
SellBuy
Strong sellStrong buy
Strong sellSellNeutralBuyStrong buy
Summary
Neutral
SellBuy
Strong sellStrong buy
Strong sellSellNeutralBuyStrong buy
Summary
Neutral
SellBuy
Strong sellStrong buy
Strong sellSellNeutralBuyStrong buy
Moving Averages
Neutral
SellBuy
Strong sellStrong buy
Strong sellSellNeutralBuyStrong buy
Moving Averages
Neutral
SellBuy
Strong sellStrong buy
Strong sellSellNeutralBuyStrong buy
Displays a symbol's price movements over previous years to identify recurring trends.
Frequently Asked Questions
The current price of COHN is 10.49 USD — it has decreased by −0.24% in the past 24 hours. Watch Cohen & Company Inc. stock price performance more closely on the chart.
Depending on the exchange, the stock ticker may vary. For instance, on AMEX exchange Cohen & Company Inc. stocks are traded under the ticker COHN.
COHN stock has risen by 1.22% compared to the previous week, the month change is a 23.82% rise, over the last year Cohen & Company Inc. has showed a 18.13% increase.
COHN reached its all-time high on Mar 19, 2004 with the price of 1,295.00 USD, and its all-time low was 2.77 USD and was reached on May 12, 2020. View more price dynamics on COHN chart.
See other stocks reaching their highest and lowest prices.
See other stocks reaching their highest and lowest prices.
COHN stock is 3.71% volatile and has beta coefficient of 1.02. Track Cohen & Company Inc. stock price on the chart and check out the list of the most volatile stocks — is Cohen & Company Inc. there?
Today Cohen & Company Inc. has the market capitalization of 281.37 M, it has increased by 1.46% over the last week.
Yes, you can track Cohen & Company Inc. financials in yearly and quarterly reports right on TradingView.
COHN net income for the last quarter is 329.00 K USD, while the quarter before that showed −1.95 M USD of net income which accounts for 116.85% change. Track more Cohen & Company Inc. financial stats to get the full picture.
Yes, COHN dividends are paid quarterly. The last dividend per share was 0.25 USD. As of today, Dividend Yield (TTM)% is 9.62%. Tracking Cohen & Company Inc. dividends might help you take more informed decisions.
As of Jul 18, 2025, the company has 113 employees. See our rating of the largest employees — is Cohen & Company Inc. on this list?
EBITDA measures a company's operating performance, its growth signifies an improvement in the efficiency of a company. Cohen & Company Inc. EBITDA is 35.07 M USD, and current EBITDA margin is 21.19%. See more stats in Cohen & Company Inc. financial statements.
Like other stocks, COHN shares are traded on stock exchanges, e.g. Nasdaq, Nyse, Euronext, and the easiest way to buy them is through an online stock broker. To do this, you need to open an account and follow a broker's procedures, then start trading. You can trade Cohen & Company Inc. stock right from TradingView charts — choose your broker and connect to your account.
Investing in stocks requires a comprehensive research: you should carefully study all the available data, e.g. company's financials, related news, and its technical analysis. So Cohen & Company Inc. technincal analysis shows the buy rating today, and its 1 week rating is buy. Since market conditions are prone to changes, it's worth looking a bit further into the future — according to the 1 month rating Cohen & Company Inc. stock shows the buy signal. See more of Cohen & Company Inc. technicals for a more comprehensive analysis.
If you're still not sure, try looking for inspiration in our curated watchlists.
If you're still not sure, try looking for inspiration in our curated watchlists.