COPX - bully bounce timeCOPX took another hit today and lost +4% which is a little surprising considering Max Pain this Friday is $37... maximum-pain.com
Expecting a turn soon. Probably starting next week after some more pain and fear...
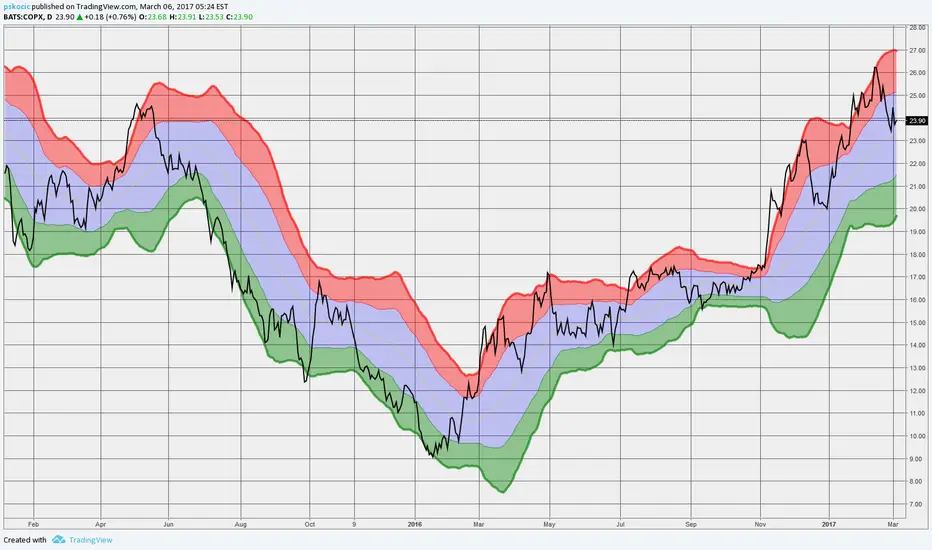
Indicators appear to be looking for a turn on the daily, and Volume is drying up on this leg down.
Potential selling climax on July 19th.
Bollinger' Band width can go lower but not much IMO before a turn.
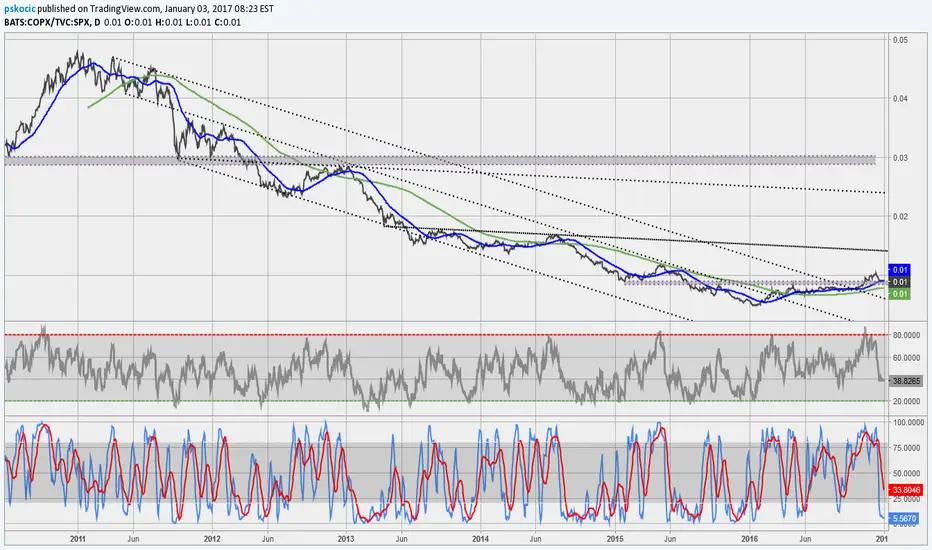
New high isn't likely given the drop out of the longer term regression channel.
Tradable bounce - lasting ~30 days...maybe less on deck for COPX.
Maybe another 3% to 4% down. Falling knifes and all... buy the fear.
Bounce Target = $40.xx See Chart
Not financial advice.
COPX trade ideas

#Copper #globalcopperminers #copx Potential Bullish Bat#Copper #globalcopperminers #copx seems to have more downside.
After completing bearish Crab pattern with three desired targets archieved now instrument still seems to have some downside momemtum with a trend line broken and retracement going below 61.8%.
Looking for a completion of bullish Bat pattern after breaking 75MA. BB walk started so later looking volatality divergence near bat pattern completion.
200MA approaching could act as support. RSi (7 and 14) showing OS/bearish strength for now.

Copper Miners ST Top COPX wave 5 top lies out of channel around the 25th of June.
The end of June will be in my mind, 25th-28th have recurred as dates of peak projections on so many charts of mine that I will make a trading plan around it. We could see a slow down in metals and miners late summer into the autumn. I think Q4 will probably rip into a larger crash, not so sure on the David Hunter Q3 Bust, maybe Q4.
A correction at that point may retrace a minimum of 15% to the 50D MA

How To: Ride the Copper Boom while Protecting Your Downside. I have been seeing articles about Copper shortages but hadn't really paid much attention to them. My interest was sparked looking at one of the latest TradingView Editors Picks which was a chart of Copper pricing and how it has been in a nice steady uptrend for the last year.
What's driving the demand in Copper and why do I think it might continue upwards - well apparently copper is critical for solar panels, wind turbines, electric vehicles and battery storage - and there has been a massive surge in demand, but the miners haven't been expanding rapidly enough or finding enough new sites to keep up with the volume.
I thought I would go looking for a Copper Mining ETF so I can invest in the industry overall as opposed to individual companies and liked the look of COPX which is now up close to 300% since March last year. The advantage of the ETF is I want to hold it for a longer period than an individual company so I am looking for gains - but with less volatility. Makes it more suitable for some of my long term holdings. With COPX I get a basket of miners across Canada, the United Kingdom, Hong Kong, United States, India, Australia, Mexico, Poland, Sweden, and Japan so in theory might reduce some of my risk as they will be able to supply companies globally without so much political interference or local issues out of their control such as natural disasters. That's the theory anyway.
The chart looks nice and steady so I want to stay in the trade as long as possible - potentially years, until enough new mines have opened - or perhaps another battery mineral replaces copper.
So once I have picked my entry I will look to set a trailing stop loss to protect any reversals - but at the same time I want it wide enough to keep me in while there is any volatility. I don't want to get stop hunted along the way. Based on the last 12 months of price volatility a stop around 16% or so looks like it will meet this criteria. Things can of course change. If some new comes out about replacing copper as a key ingredient in these devices I may tighten my trail and look to exit earlier, but for now it seems about right.
COPX could be worth a look - OR - you could look to invest in some of the individual miners that make up the ETF and try and outperform it.
Have a look at either of these two ETF sites for more information with a breakdown of what's in the ETF. ETFs are fun :)
www.etf.com
etfdb.com

Copper continuting to riseCommodities have been on a tear lately. This trade on COPX is a good one to catch. Since the move has started it would be wise to use the first ray at 35.97 as a target if you're a little bit squeamish.
Lately, the way these ideas have been moving I decided it's best to move my targets higher since by the time the alarms are triggered and I get to adjust, the TP has already been hit. My take profit is about 2.04 reward risk ratio and as you can notice the ideas that have hit Stop loss result in losing less than gaining on the ones that hit.

Copperelectric everything needs copper, motors, grids... volume profile showing no more sellers above for resistance covid mining disruptions causing shortages

COPX and COPPER - Miners Upside into MarchMiners (COPX) rising daily channel (blue) tops out the Monthly (Grey), coinciding with fib levels (previously respected).
The window shown in purple is the current max price target and timeframe for summer volatility, where an intermediate decline is expected before resumption in the fall after the window closes.
This timing thesis is my personal favorite (calendar day-wise) for sale (March-end) and re-buy (August end/September).
Constructive criticism welcomed.

Copper Outlook /long-term Technical Analysis
We have broken the long-term resistance trend that had been in place for almost 10 years.
RSI is very overbought, but this market has proven overbought can stay overbought for a long period.
In the chart there is 3 potential targets for Copper in the long-term picture.
There are several place to take profits and/or add on pullbacks. (These are the orange segment lines)
Fundamental Analysis
Industrial metals have been rallying strong; and are likely to continue with expected infrastructure investment for 2021 and further.
Copper is also used in Semiconductors, which is the basis of all technology hardware.
Steel is behaving in a very similar fashion, adding to the idea of industrial metals outperforming precious metals.

How good is the Copper (COPX) 10yr chartI rarely look at charts over 3 years but have heard a few people talking about Copper lately so thought I'd check it out!
There is so many long term pivot points visible and we are on the way to reaching one of those points again.
The April 2011 high and Jan 2016 Low creates long term Fibonacci channels of which we are now sitting at the the 0.236 level ($21.25), we've been through this level at least half a dozen times since the low but never before have we been able to break above the long term resistance line which reaches all the way back to the 2011 high, four times this had been tested and failed but not this time. We've been trending up nicely since the March crash and have blasted through that mentioned level quite easily in July. So now if we can keep above the Fibonacci level we are currently sitting on then the next stop looks to be $23.40 which has also been both a resistance and short term support line in the past few years. Common Copper, we've got ~$2 of profits if you don't fall away from this Fibonacci level.
These are my personal views and I'm not a registered advisor, please do your own research before risking your hard earned money!

Making progressThe December monthly candle closed above the resistance line for the first time in many years, with the most volume ever in one month.
MACD is about to cross bullish.
Currently holding immediately below 26-month EMA resistance.

Copper --> Trade war indicatorConcern grows over global economic slowdown. The US continues to be a leader (for now).
China is the largest copper consumer, and has been beaten down. Technicals don't look good at all. At least there is no divergence.
If Trump and Xi don't reach a deal, you must know - copper will absolutely go down.
P.S:
COPX (Global Copper miners)
CPER (United States Copper)


Copper testing support Copper testing the inverse head & Shoulder neckline with inflation data on the upswing
RSI testing null market support near 40
Worth for a shot for further rally

low volatility 'safe' trade
use caution as negatively sloped
but the -tve slope mitigated but strong seasonality of copper through to the end of April.
I expect a min price as indicated, but will likely see much more as the run should continue past what i have indicated.
Nice risk reward of 8+ min

COPX - Copper follows the ForkPrice overshoot the U-MLH of the downsloping Fork, but came back into the Fork.
Now there is a big chance that price will make a nice move to the downside.
Besides COPX I usually doublecheck with the HG1! Futures, and they are in line now.
Curious if it falls down to the Centerline, or if it stops at the L-MLH.
P!

Weekly COPPER - SHOULDER HEAD BOTTOM
- Bullish indicators
- Cup-handle pattern
Conclusion: Weekly long
Risk: Bullish trap after breakout in the short term, set STOP at $24 in short term and at $19 for long term