Chinese Tech vs US TechChinese Tech vs US Tech | I don’t know if you’ve had a look at the relative/ratio chart of Chinese Technology Sector Stocks (CQQQ) vs US Technology Sector Stocks (QQQ). My review of the chart sees China tech starting to outperform US tech on a relative basis. A major two-year downward trend line has been breached, with the price finding support on it’s 100-day moving average, which is also starting to trend higher.
CQQQ trade ideas

CQQQ, trying to etablish an uptrendAMEX:CQQQ on daily charts is trying to finds its wings to fly, awaiting clear direction
I have showed a few cases here, where after a significant up-move, we had a double top formation and also bearish divergence on the RSI, indicating high probability that the uptrend may end and fizzle out and then after a significant downside, price formed a double bottom, signifying that trend may reverse or at least bottom out.
Over the next few months, we saw a peak of 36% returns on investment since signal identified
As we speak, price is trying to break the $ 50 mark. At this stage, price is respecting the upward trending bottom channel but is failing to make higher highs, entering in somewhat a congestion zone.
Look out for this space closely as this may give us more confirmation on which way markets could break out
Happy to hear your views.
If you like what you see, please share a thumbs up and follow me for more ideas
Cheers

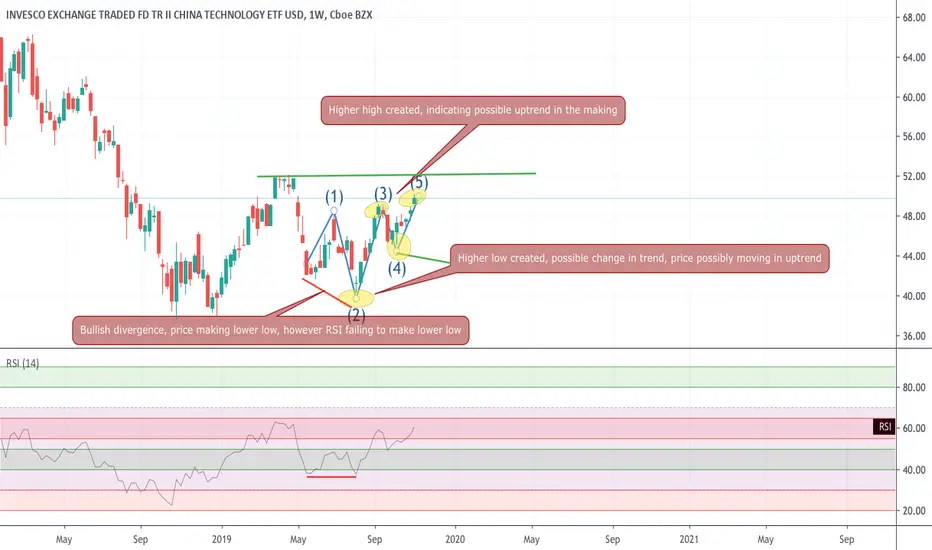
CQQQ, on weekly charts gaining strength - buy set upAs seen on the weekly charts, CQQQ seems to be changing directions. Bullish divergence seen recently as indicated in the chart and price getting into an uptrend, recent week high also broken and price now eying the 52.31 level breakout.
Important to see a retest and look out for price retracing and confirmation of uptrend if price makes a higher low than the most recent previous levels
2 ways to play
1. wait for higher low to be created and if next candle after that formation is positive, go long
2. Incase you want to wait for further confirmation, then wait for 52.31 levels to be breached and then go long
IF you like what you see, please share a thumbs up
Cheers
CQQQ - breakout - long with close Stop lossHi Friends , breakout on daily time frame on AMEX:CQQQ .
Look at the breakout with the Green candle peeping out of the triangle formation. RSI and ADX both showing strength (DM crossover the DM- but ADX still weak, but looks like gaining strength.
Watch out for possible retest of the newly found support line ( earlier resistance line) for a possible throwback down to the trend line and then momentum pulling to upwards if the news flow from the trade talks with China remain positive.
If the price renters the triangle then expect the lower support levels of the triangle to be tested fairly soon.
Please note, wait for candle formation (for daily timeframe, wait for close levels to confirm breakouts and also retest levels for finalizing any trade
One could look at entry at this level and place stop loss at 47.50 levels.

China technology weekly chart insights - CQQQAs we can see from the monthly and weekly chart analysis, AMEX:CQQQ got into a one way run up bullish trend from mid 2016 right up to October 2018, at which point markets got a consolidation stage and bulls were unable to make higher highs and found resistance price peaking near USD 67 levels. At this stage, when you observe the weekly charts carefully, price action formed a Triple to formation and soon the bears tool over and once the pattern was completed, the markets saw a change in trend and CQQQ went into a downward trading channel.
It's interesting to observe how the triple top formation, which is a bearish signal at peaks after sustained long term uptrend, was giving out the signals confirming the break. If you observe the first peak in the formation, the green candle on top shows price action where the bulls tried to push the price higher during the day but the bears closed the lower to the weekly high levels. On the second peak, the green candle shows that the bears pulled the price lower to the open, bu the bulls closed at a high. On the third peak, we see a red candle with a Doji, indicating indecision and a possible change in control between the bulls and bears, which is only confirmed after the break of the support zone at the bottom of the triple top formation. However, do note that while the peaks were rather parallel, the bears were able to pull the price lower at each trough of the formation and mostly the red candles were accompanied with higher volumes
Once the triple top was established and breached, price went into a downward channel, it found support once the price had fallen just below USD 40 levels. At this stage, do note that the RSI indicator had started brushing the oversold space and price found support at these levels and the bulls pushed price back into slight higher zones.
If you correlate the weekly and daily charts, the price is now moving in a rectangle and its interesting to note that the price has entered the rectangle set up from top, likely a continuation pattern, and may have a tendency to exit below. However, critical to observe the direction in which breakout happens.
Currently, the price is sitting above the long tern trend line and this will continue to act as a major support going ahead.
Always remember, trading inside the rectangle is dangerous, look out for breakouts, that's where you have higher probability of positive trades and also higher profit levels
If you have any views, please share. If you like what I share, please leave a thumbs up.
Thanks

CQQQ Broke Out Above Bullish FlagThe ETF AMEX:CQQQ presents a great opportunity for a bullish move to around $55.80.
As it broke out above a bullish flag, and there is a nice ascending trendline, we get a good Risk/Reward ratio going into the next price cluster. We can put the stop loss below the previous resistance and the ascending trend-line.


Long CQQQStory : The Chinese technology stock market has suffered substantially this year for a number of reasons - to put some perspective to this, XLY0 is down 19% YTD, while CQQQ is down in excess of 25%. Be it the trade war with the US, the feared slow-down of the Chinese economy or other political / geopolitical regional tensions the sector has been beaten down to levels that appear particularly attractive. From a technical perspective CQQQ has reached levels which if broken would indicate a return to the pre-2015 levels, something that would both imply and trigger substantial recession calls.
Entry Price : USD 45.60
Stop Loss : USD 42 (-7.89%)
Take Profit : USD 55 (+20.61%)
Expected Duration : 2-4 months

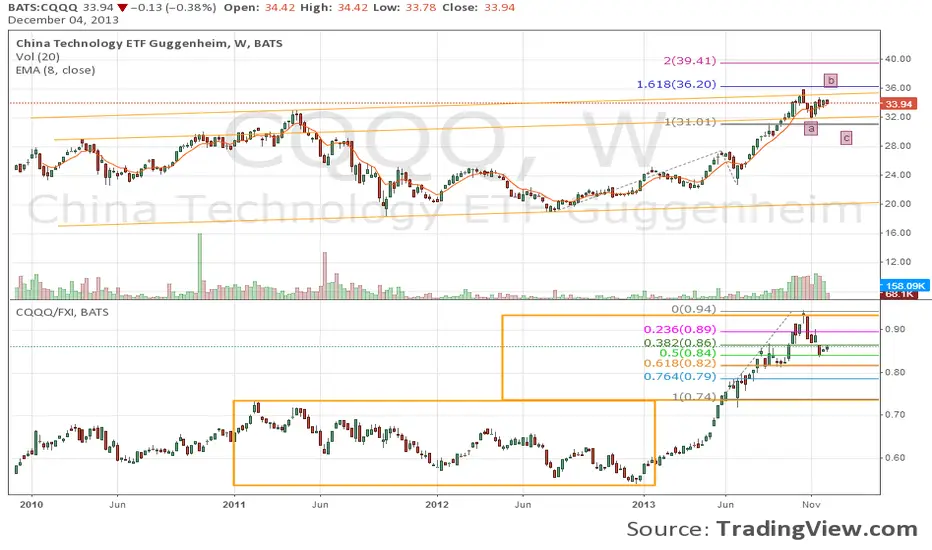
CQQQ weeklyOne to watch for China (Baidu, Sina, Sohu, Netease, Shanda, Sunpower...). ABC correction possible under 8EMA.