DIA Short/Put Entry Coming perfect Short entry coming. lose VWAP YTD and key Fib. let the rest do its job
DIA trade ideas

Short DIA @ prior months resistance Once an area or “zone” of prior resistance has been identified, those price levels can serve as potential entry or exit points because, as the price reaches a point of previous support or resistance, it will do one of two things: bounce back away from the support or resistance level, or violate the price level and continue its trend until it hits the next support or resistance level.
As most other major market indices are at 200-day SMA support we are taking a short position in DIA at the prior months' resistance zone.

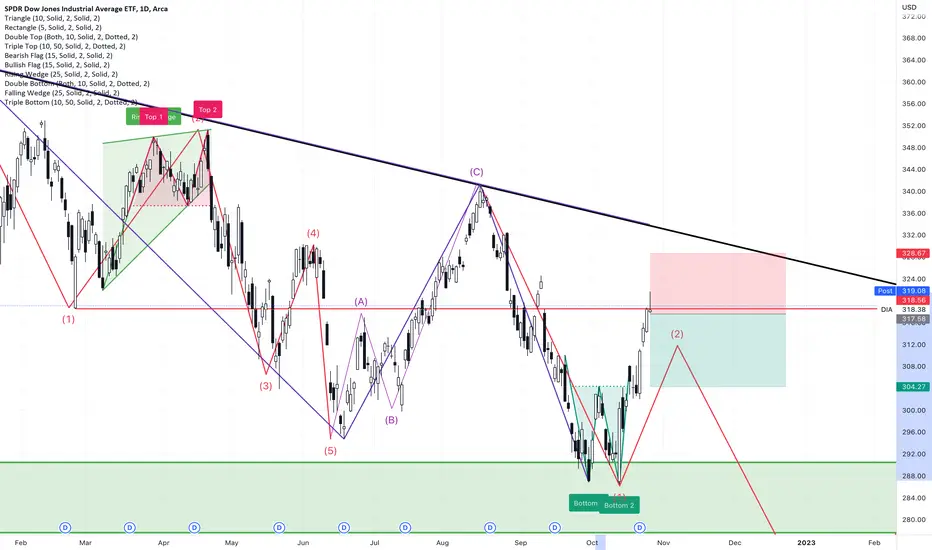
DIA: Surfing a Fib LineAMEX:DIA
DIA has broken a long term negative trend line. 4h chart holding negative MACD, with 1D MACD looking to roll over to the negative side. Price hanging steady in the mid 330 range for the past week turning the 9sma flat and surfing the .618 Fib line. Continuing to monitor looking for a reaction off the Fib line

Return to Normal Rally for DJIA$DIA is showing a negative Monthly RSI divergence and this type of price action is emblematic of a 'return to normal' rally after a bubble pops. Chart points to further losses into 2023. I would personally heed the warning coming from Jeff Bezos and others. I am still bearish on equity markets given rates, geopolitics, and the FTX fallout.

Support Bands Indictor $DIABoth Support Bands are Green For first time after a few Months
Trend is Clearly transitioning.
Re test the 50WMA or Trend Line.
Be ready.

DIA: Week of Nov 14Hey everyone,
As I said and requested, here is my analysis on the DOW.
The DOW (DIA) and the Russel (IWM) are actually the most bullish looking stocks, at least as far as math and probs are concerned. Lots of bullishness is just being thrown in our faces here.
Let me break down the probabilities by index so you can just see this visually. The chart below shows the probability of the 3 indices (SPY, DIA and IWM) hitting either their first bull target or their first bear target:
So let's recap:
First off, we have a very clear breakout and hold from the qualitative regression downtrend. This is a traditionally bullish happening.
As with SPY, we have hit the second real time monthly bear target and on Friday we hit the first, real time (RTT) monthly high target at 337.79.
The next RTT is 341 followed by the third at 345.
While I was super focused on the numbers and the regression trend, I missed something that may have been obvious had I been paying closer attention:
This seems to, at this for right now, be following through.
Analysis:
So what can we expect next week?
DIA is yet to be put into Python for auto calculation of probs, so I had to do it manually and I forgot how much of a nerd I am. I love writing out math stuff haha. Anyway, our prospective targets are:
Bull:
1. 339.08 (50% prob)
2. 341.66 (6.1% prob)
3. 344.24 (<0.50% prob)
Bear
1.335.29 (38% prob)
2. 331.92 (0.3% prob)
3. 328.55 (<0.3% prob)
Technicals:
Unlike with SPY, Buyers have remain consistent. DIA is a little bit lower volume that SPY and can really signal a bit better what the buyer/seller sentiment is. So let's take a look at the buyer to seller ratio chart. And let's look at it YTD over the weekly.
And just for fun lets compare buyers to sellers on SPY vs DIA YTD:
Not sure if this is helpful, but I find it interesting haha.
For Monday, the technicals are erring on the bullish side. The targets are as follows:
Bull:
1. 337.51
2. 338.89
3. 340.27
Bear:
1. 336.29
2. 334.68
3. 333.07
So I think that concludes everything.
As always, leave your questions and comments and criticisms below!
Have a great weekend everyone!

DOW - Hits Downtrend Line!The move in the Dow over the last 21 trading days has come to the very top of its downtrend line up 5100 points or 18% since October 13th. Significantly overbought with many components up 30-50% in the same time. Book the profits and don't stick around too long. Happy Trading!

DOW JONES INDUSTRIAL Major Level here! The Dow Jones Industrial Average Indice is seeing a major runup the past few weeks since the beginning of October.
The Dow has seen record gains of 17% since its bottom in Early October.
The Dow is now running into some big-time resistance... That is our focus today to dive in to.
The 30 companies pushing the Dow up may be becoming overbought indicated from RSI and other oscillators.
TrendLine 1
But what we're looking at is the Dow's trendline analysis. We are seeing a Long Time Resistance Line Dating back actually all the way to 2008 guiding as a mean resistance point being touched now again! This marked 'Blue' Line represents that resistance and the Dow is approaching and testing that level now. A Rejection could lead to a selloff, if History Repeats and Dow does not want to head higher at this time.
OPINION : Dow will only break this trendline if looking to really meltup or erase losses and hit All Time Highs. If this is not the case yet, I do not see this breaking upwards at this level.
TrendLine 2
This Trendline has lasted and been intact since the kickoff of the 2022 Bear Market.
We have seen numerous Retests and Rejections of this Resistance Line, and we are now testing this again.
We have YET to break through this barrier, as it guides the market lower & lower.
Again The Dow will need major buying to break thru these levels, as massive resistance is present.
OPINION : Same as above, I can only see a break upwards if buyers really believe Dow is going back to ATH or erase gains in a massive market melt-up
Contrarian to my Writing : This article mainly features idea of a rejection, but one thing that particularly makes me more bullish on Technicals here is that the S&P / NASDAQ have yet hit their own bear market trendlines and this could rally the market up higher to those areas. If this happens, it is likely the Dow follows this movement somewhat, and could see a break above.
Something to keep note of!!!

$DOW JONES INDUSTRIALWe can consider many factors to determine what will be our future direction, but once a trend is developed is more likely to follow than change it.
The support bands suggest that the Trend is changing direction on the weekly chart.
For the time the J Powell decide to pivot, TML will be way gone.
Look for those market leaders the will double in a short time period.


DIADow is looking the best of the 3 main indexes but struggling again with a downward sloping 200 sma. Bearish until it can get above there imo.

DOW JONES kissed the 200 moving averageDOW JONES kissed the 200 moving average and going down
we might see some retracement on dow jones. Lets see
---
I cover various stocks which can be profitable based on the stock charts and technical indicators. I try my best to explain as detailed as possible but your feedback is also appreciated
Before you enter a trade , one must learn how to master the charts as Stock charts play a big role in deciding when to buy or when not to buy. Technical Trading help in predicting price movements and have a risk management. Stock trading is like any other business and must be taken seriously. Lot of people lose money because they don't educate themselves and end up placing trades blindly which results in big losses
Stock charts is the major component day traders, swing traders, core traders use. Times and technology has changed and if you cannot adapt to the new methods , there is a high chance you will be left behind
Millions of shares are traded now using desktop , laptop or gadgets and stock charts is what majority of traders look at.
So , if you want to be a daytrader , swingtrader or coretrader learn how to read and interpret charts. There are lot of great books out there like Thomas Bulkowski's Encyclopedia of chart patterns and Steve Nison Japanese Candlesticks interpretation
Having someone experienced can also cut the learning curve time for a new trader. Trading does take time and with discipline , hardwork , dedication and most importantly Passion for this needs to be there.
Iam posting some of the best phrases from successful people:
-All that matters is how you see yourself. If you see yourself as the king, with all the belts and everything, and no matter what no one else says, as long as you see that, and really believe in it, then that’s what’s going to happen
-If you believe in yourself and have dedication and pride - and never quit, you'll be a winner. The price of victory is high but so are the rewards. Bear Bryant
-We all have dreams. But in order to make dreams come into reality, it takes an awful lot of determination, dedication, self-discipline, and effort. Jesse Owens
-In order to excel, you must be completely dedicated to your chosen sport. You must also be prepared to work hard and be willing to accept constructive criticism. Without one-hundred percent dedication, you won't be able to do this.
-Patience, persistence, and perspiration make an unbeatable combination for success
-Trees and grass need time to grow, and therefore, they symbolize patience. We need time to achieve goals, especially big goals, and this requires patience. ... If we are too impatient, desiring to have immediate results, we might be disappointed and quit our goals.
-Courageous persistence is the one quality more than any other that can guarantee success. ... The definition of persistence is the quality that allows someone to continue doing something even though it is difficult or opposed by other people.
-Doubt is only removed by action. If you’re not working then that’s where doubt comes in.”
-I believe in myself so much that nothing is going to stop me
-There’s no talent here, this is hard work. This is an obsession. Talent does not exist, we are all human beings. You could be anyone if you put in the time. You will reach the top, and that’s that. I am not talented, I am obsessed
-Approach ev

DIA daily bearish hammer at resistance and double bottom targetOrder SELL DIA ARCA Stop 317.58 LMT 317.58 will be automatically canceled at 20230401 01:00:00 EST
DIA daily bearish hammer at resistance and double bottom target expect retest of the neck at least.
DIA daily consolidation after long day candleOrder BUY DIA ARCA Stop 305.35 LMT 305.35 will be automatically canceled at 20230401 01:00:00 EST
DIA daily consolidation after long day candle. I mean, if we clear this local high pivot, we can go retest the trend line.

DIA weekly bearish hammerOrder SELL DIA ARCA Stop 288.66 LMT 288.66 will be automatically canceled at 20230401 01:00:00 EST
DIA weekly bearish hammer stop loss above candle.

Few good pattern potential stocksFew good pattern potential stocks to trade for week of October 24
Boom boom boom
Lets make some money


Who Won the Georgia Debate? Roll Herschel! Was it Herschel Walker (R) or Sen. Raphael Warnock (D)
I feel it is important to the market or I would not bring this up.
Maybe I am just a humongous football fan.
Time will tell (o"
Perfect English does not always mean a whole he!! of a lot in the scheme of things? Sometimes the honesty shines through over the perfected speech that is so programmed that it only serves as an instrument to attempt to make you feel dumb.
I am not dumb!
I am not from Ga either but this race means something to me and I am not sure why?
Roll the Tide Herschel Walker (o:

Dow Jones Industrial Average relative strength on the riseThe overall US equity market is still having a hard time stabilizing and catching its footing, however, if we examine the major US indices closer we do notice more and more relative strength coming out of the Dow Jones Industrial Average.
This past week it never took out its September lows, the MACD momentum oscillator continues to climb aggressively, and on Friday we remained in the top 1/3 of Thursday's bullish engulfing bar.
I started a position on Thursday and will keep a tight leash risk managing it going forward. More notes on the chart.

DIA bearish hammer on monthlyWell below POC, nothing in our way till next resistance. Good 1.2 R
Probably wave 5 of downtrend.

DIA daily second bearish hammer in a rowSell Stop 290.66 LMT 290.66 GTC
Buy Limit 277.78 GTC
Buy Stop 297.98 GTC
DIA daily second bearish hammer in a row wave 5 downtrend

DIA daily divergence break of the trend Order BUY DIA ARCA Stop 295.32 LMT 295.32 will be automatically canceled at 20230401 01:00:00 EST
DIA daily divergence break of the downtrend. Take profit Fibonacci 50% retracement. Stop loss under recent low pivot.

Another Crooked M 1.414//Economic Reports Remaining this WeekWide Channel Down/Marubozu Candle with both ends shaven//Price sits above the .382 of the trend up/No recent pocket pivots noted.
No recommendation
WEDNESDAY, OCT. 12
8:30 am Producer price index, final demand Sept. -- -0.1%
2 pm FOMC minutes
THURSDAY, OCT. 13
8:30 am Consumer price index Sept. -- 0.1%
8:30 am Core CPI Sept. -- 0.6%
8:30 am Core CPI (three-month SAAR) Sept. -- 6.5%
8:30 am CPI (year-on-year) Sept. -- 8.3%
8:30 am Core CPI (year-on-year) Sept. -- 6.3%
8:30 am Initial jobless claims Oct. 8 -- N/A
8:30 am Continuing jobless claims Oct. 1 -- N/A
FRIDAY, OCT. 14
8:30 am Retail sales Sept. -- 0.3%
8:30 am Retail sales ex-motor vehicles Sept. -- -0.3%
8:30 am Import price index Sept. -- -1.0%
10 am UMich consumer sentiment index (early) Oct. -- 58.6
10 am UMich 5-year inflation expectations Oct. -- 2.7%
10 am Business inventories Aug. -- 0.9%
