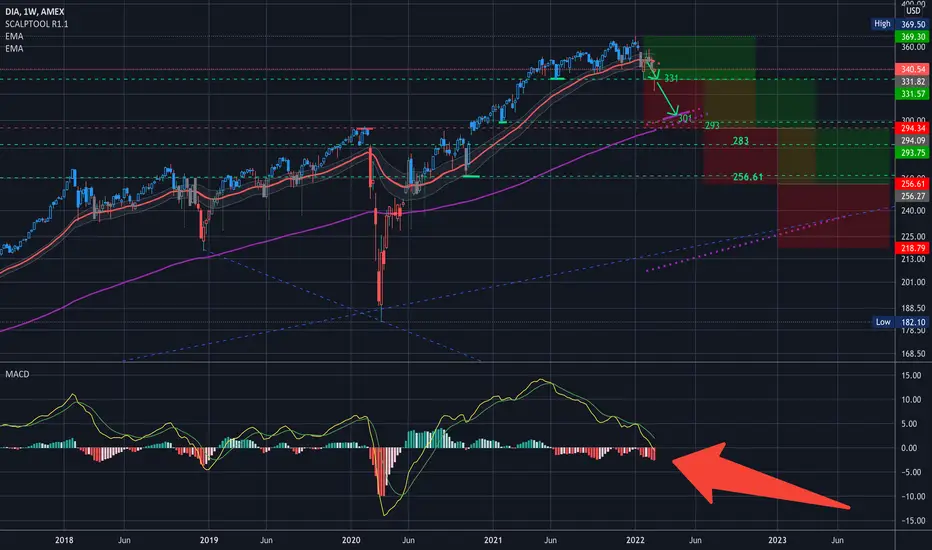
$DIA Analysis, Key Levels and Targets. $DIA Analysis, Key Levels and Targets.
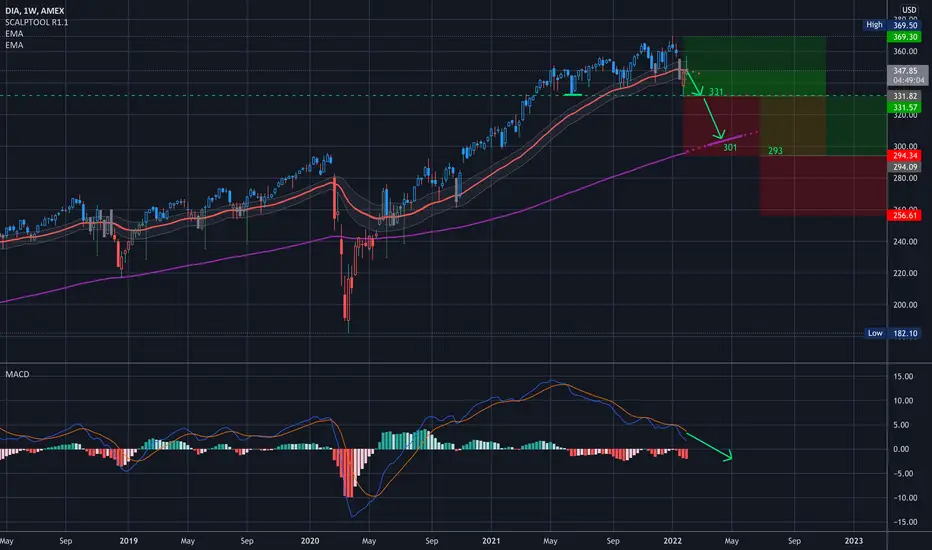
That 331 got hit… and there’s not a whole lot of resistance from here to about 301… to maybe 293 and actually theres a gap at around 283 too to watch … That would be my next place to swing.
That would also be about the top of the pre-pandemic top, which personally I think it needed to correct back then…. So
GL
DIA trade ideas
SPY, QQQ, DIA, & US2000 [3D Candles] - Looking Eerily Similar The major indices as represented by respective ETFs have over the past few weeks become more and more similar in price structure on their daily and weekly charts, among other timeframes. The top left chart is AMEX:SPY , the top-right chart is the NASDAQ:QQQ , the bottom-left chart is the AMEX:DIA , and the bottom-right chart is the FOREXCOM:US2000 (technically a CFD as opposed to an ETF).
For purposes of balancing sufficient detail of the most recent price action against a wide enough view of the larger uptrend context since just after the March 2020 panic low, all four price charts use 3-day candles.
While all four of these tickers -- and therefore their underlying indices -- have experienced a rather pronounced and sustained weakness giving way to a not insignificant period of decline basically since the start of 2022 (with obvious acceleration to the downside more recently, save for the rather modest relief rally experienced several weeks ago), a brief "breather" in the decline for the market to digest the move and chop around for a bit should not be unexpected. That being said, the overall current price structure, sentiment, trend, and momentum -- all from a more traditional technical analysis perspective -- is unmistakable. All four instruments/tickers exhibited well-behaved price action respecting a very clean and orderly up-trend support line since Spring/Summer 2020 -- almost two years obeying a very well-defined clean uptrend support line. That is, until recently. Not only have all four charts broken below the uptrend support line on both daily and weekly candle charts, but price also closed below the broken uptrend line on both a daily and weekly basis. When presumably the retail crowd stepped in at that point to "buy the dip", all four price charts caught a temporary bid rallying back up to near the underside of the broken uptrend line previous-support-now-turned-resistance, thus confirming the trend reversal,
It is recognized that geopolitical tensions and events are almost certainly playing a role in exacerbating the recent market moves over the past few weeks, it should be noted that rarely if ever can various happenings in the financial markets be attributed to one thing or cause. There are almost always, nearly without exception, multiple causalities contributing to a given situation. For example, in the present scenario, there were reliable indications that the GDP in the USA was beginning to slow in rate of change terms as early as later 4Q-2021, while inflation was at multi-decade highs thus exerting political pressure on the Federal Reserve to reverse course and take a hawkish stance as to monetary policy by at eh very least "jawboning" the market into believing that very aggressive rate hikes to the tune of 50 bps up to even 100 bps had a very good likelihood of happening by March 2022, coupled with Quantitative Tightening (i.e., taking back some or a lot of all that crazy large amount of "liquidity"/money he's been injecting into the system over the last two years which has juiced the financial markets to such high levels). But just as flooding financial system and it's cronies juiced the stock market up so far so fast so aggressively cause all that new money had to find someplace to go, it doesn't take a rocket scientist to figure out that happens when the opposite occurs (liquidity/excess-money-reserves are drained from the banking and financial system, even if done in a somewhat cautious, deliberate, and slow manner). And to add "insult to injury", if Jay Powell and the Fed do indeed tighten monetary policy into a decelerating macroeconomic/GDP backdrop, this would be a double whammy. Perhaps even a triple whammy, since we additional aggravating and complicating macroeconomic factors such as the PCE (Personal Consumption Expenditure) which is a specialized measure of inflation that the Fed uses and pays close attention to, and which is by the Fed's own admission alarmingly high and furthermore has a history of remaining stubbornly high once it gets up high in it's particular measure of inflation -- with the Fed admitting that they've had very little if any historical success in bringing that PCE number down once it gets going and feeds upon itself.
So, short story long: you may or may not see a relief rally in the markets over the next few days/weeks (or not), but it would be wise to keep in mind that the present market "turmoil" was set in motion before all the Russia talk the past few weeks. So keep your wits about you and maintain a critical mind.
DISCLAIMER (FOR THE 'G-MEN' GOONS OUT THERE):
The above is presented exclusively for informational, educational, and/or entertainment purposes only. Nothing herein is intended to be, nor should be construed as legal, financial, tax, or any other professional advice of any kind whatsoever. Nor are any statements contained herein intended to be an invitation to form any type of professional advisory relationship including but not limited to attorney-client relationship, financial-advisor-client relationship, tax-advisor-client relationship, or any other professional relationship whatsoever may be regulation or prohibited by law. The above statements are the personal opinions of the author, made with explicit disclaimer of all warranties, whether explicit or implied, as to the accuracy of said statements; and as such the information presented herein should not be relied upon in any capacity. Financial/Capital markets are inherently risky and accordingly carry a significant risk of loss, especially for the inexperienced as well as small retail investor. Before considering any financial decision, especially before considering participating in the capital markets by putting personal capital at-risk, prudence dictates consulting with a qualified professional financial advisor, a qualified tax or other specialist attorney licensed in your jurisdiction. Never risk more money in the financial markets than you are comfortable and 100% willing to lose plus not suffer material hardship to your overall financial wellbeing if you lose it all.

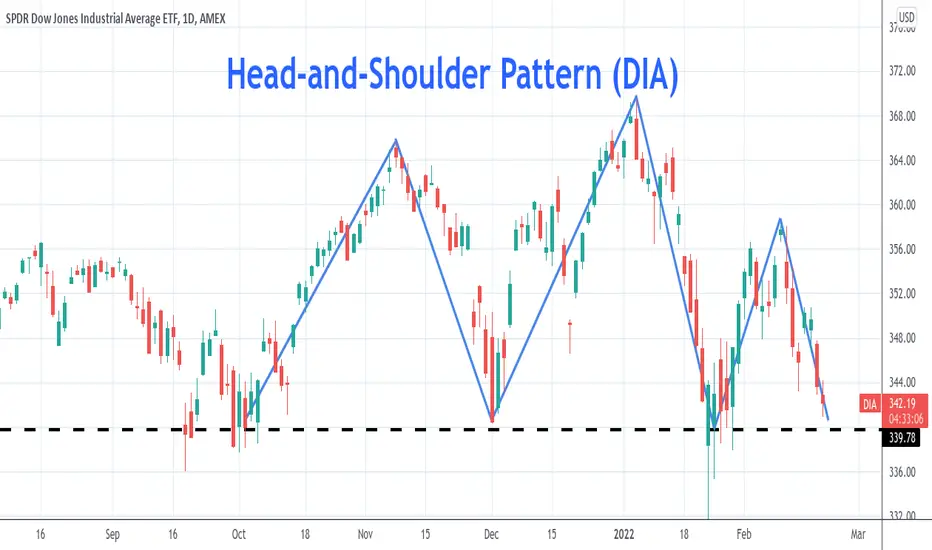
Head-and-Shoulder Pattern (DIA)- Five months head-and-shoulder pattern is near completion for DIA
- Head was located at 370. Two shoulders were defined with its neckline at 340
- This is a very important moment to watch how Dow Jones behaves on its key level 34000 (DIA 340)
- Falling below 340 will conclude the 12 years-old bull cycle. In addition, the neckline 340 will form a resistance level or the beginning of the bear market.
DIA swing puts entry 350 -352I just bought swing puts. I cannot say if DIA will move up to 352 so I started a position with price over 350. In a swing trade even if price moves a little higher I will hold.
One of two things will happen on RSI. Today's attempt to test the 50 will fail (it may not even get there) and head lower over the next few days. If bullish sentiment takes over, then RSI may go up to the orange line (60-65 range) before turning lower and going down to 35 or below.
As I mentioned yesterday, stochastic %K has given a clue of more downside to come (white arrow). Today %K is rising back up to %D, which is moving down (white oval). VIX is also down today, so options prices are lower.
Bought 18Mar 330 strike puts.

$DIA — Market Forecast UpdateSame story as my other posts on the other major market ETFs, so go to my TradingView account to get a description if you can't read the charts.

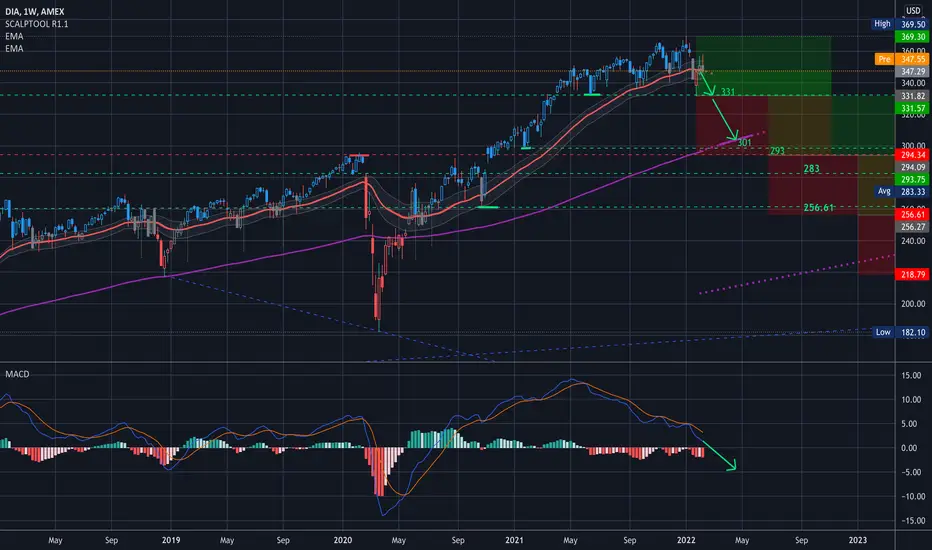
$DIA $DJIA Key Levels, Analysis & Targets$DIA Long View - looking out into mid-year - I added a few targets
What I’m thinking is a possible retest of 331… and if that breaks I’ll be looking to the 293-301 area. (And actually there’s a gap right below that so perhaps targeting that area as well… so 282, 293, and 301 would all be the next buy levels if 331 doesn’t hold
And with this I’m starting to look into Late April/May.
Let me know your thought,
And of course, this is the big picture… there will be lot’s of opportunities in both directions and I'll zoom in on some smaller time-frame plays as they come up, with the bigger move being down.
GL
——————
I am not your financial advisor, but I will happily answer questions and analyze to the best of my ability but ultimately the risk is on you. Check out my ideas, but also do your own due diligence.
I have a huge tolerance for volatility so please know that. If you’re new to my trade setups please try them on a small scale first. Then go in with a risk you’re comfortable with.
I am not a bull. I am not a bear. I just see what I see in the charts and I don’t pay too much attention to the noise in the news.
If you want me to analyze any stock or ETF just leave me a comment and I’ll do it if I can. (If I have time)
And most importantly… Have fun, y’all!!
(\_/)
( •_•)
/ >🚀
GAPSEvery Gap filled except one on 4 hour. Not advocating for trading game plan, however worth watching for reversals.


DIA PAST A B C . DECLINE NEG RSI I am now moving back to a bearish . and moving into sept puts for dia 360
BEARISH ALT COUNT DIA I HAVE JUST SOLD out of All long calls and now moved to a 100 %net short based on this wave structure . moved into sept 365 dia puts at 26.25 .If this count is what it is then we should not see the dow break the low of jan 27 and this would take the sp and qqq to new lows sp 4138/3980 qqq 321/316


Some brief thoughts about DIA's trajectoryimgur.com
imgur.com
I am attempting to put in images via url, so lets see if this works. I may have to delete and try again.
Anyway, as you all saw, SPY and DIA rallied on Friday, only to (as expected) sell off aggressively at end of day.
However, I was just updating my projections this morning and seeing where that puts me with DIA (I am in a short position on DIA currently) and I noticed something interesting that I had missed.
If you look at these line graphs (I really hope they post!), these are graphs I extract from my stats data on DIA to see how it has been behaving and if you look at it, you can see two key points that would traditionally tell me we still in a continuation of an aggressive downtrend.
These are:
1) The actual high has fallen well below the predicted high 3 weeks ago, to momentarily rally back towards the Upper Confidence high, only to be quickly rejected back down towards the lower confidence high.
2) The same is true for the predicted low.
What really stands out that I didn't notice before, is even after the aggressive rally on Friday, it wasn't enough to throw the stock off from its trajectory towards the lower confidence low level, indicating great weakness. Generally, from experience, if a rally is meant to signify a change in sentiment, I will see a divergence in the modelling towards the Upper Confidence High. I did not see this. In fact, I saw the contrary, further plummeting towards the lower confidence levels on both high and low data.
What does it mean?
It means that DIA, as well as SPY, is still very much in an aggressive downtrend.
That means that we can anticipate approaching and even exceeding projected lower confidence lows.
That means that we could be seeing lows around 342 by Monday or Tuesday and/or below.
I do hate to make these projections over the weekend without having Monday data, but this chart is pretty persuasive in my opinion.
If we get another rally on Monday, I will have to see if that is enough to start steering the stock in the bullish direction, but so far its very much on course down.
Also, you can see circled in blue similar behavior DIA did some time ago only to continue down.
Let me know if you have any questions and have a great weekend!

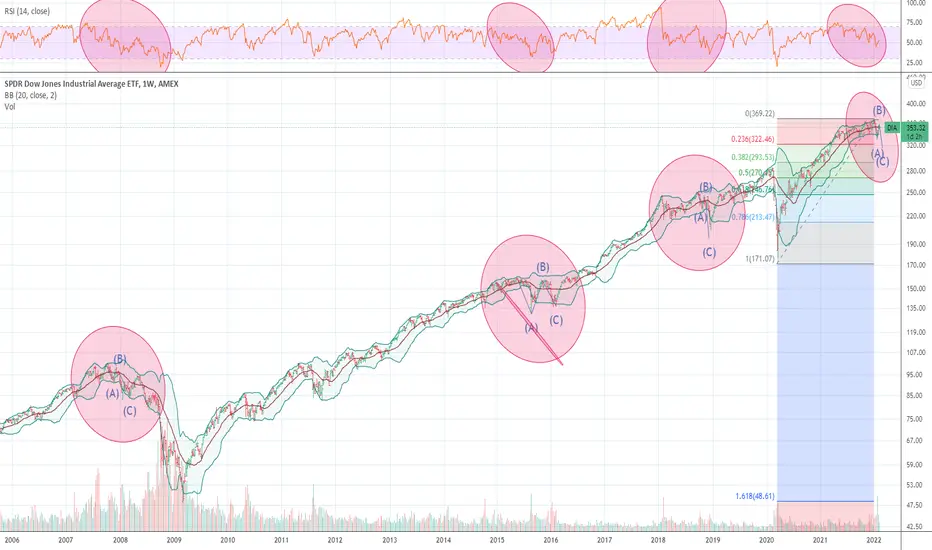
$DIA Key Levels, Analysis & Targets$DIA Key Levels, Analysis & Targets
Some number’s I’m looking at. Sorry, not much of an explanation today… I’m tired LOL.
GL
——————
I am not your financial advisor, but I will happily answer questions and analyze to the best of my ability but ultimately the risk is on you. Check out my ideas, but also do your own due diligence.
I have a huge tolerance for volatility so please know that. If you’re new to my trade setups please try them on a small scale first. Then go in with a risk you’re comfortable with.
I am not a bull. I am not a bear. I just see what I see in the charts and I don’t pay too much attention to the noise in the news.
If you want me to analyze any stock or ETF just leave me a comment and I’ll do it if I can. (If I have time)
And most importantly… Have fun, y’all!!
(\_/)
( •_•)
/ >🚀
Buy DIA swing puts at 356.40 - tech stocks weakWhile Dow Jones is moving up with the yield since 1pm, I notice NFLX and TSLA have not made a stronger bounce up. Nasdaq is relatively weaker than DJI today.
DIA just moved over 356 and retreated. I am buying swing puts at 356.40.

DIA Short.Keeping with my bias on the market I believe market structure has been broken and any rally is a short opportunity.

18Feb swing puts on DIAIf you have been following my posts you have seen me share ideas for calls and puts over the past few weeks. On this daily chart, I see price up to the 10sma as a possible resistance, or it may move up to the 200sma near 350 (two orange paths). I do not see bullish divergence in RSI and stochastic %K could make another dip as %D tries to round up. It will stay down if Dow Jones tumbles more.
I am keeping this a small position - bought 18Feb 340 puts at $4.30


Risk Model for Swing Traders (US)Our risk model for SWING-TRADERS (US Stock Market) is still showing a high risk environment.
Swing-Traders should still be very careful and keep risk to a minimum. A very few indicators in our risk model suggest that we may have reached the bottom of the current market correction.
Best way to manage the current situation is to start off with a very few and small pilot positions. If those work and your own portfolio is getting traction, market exposure can be increased.
Some details:
1. Market-Indices (Distribution Days Avg)
The distribution day count according to IBD's model is still showing a market in correction. That means that the price/volume action of the major indices are characterized by institutional selling. Not a good environment for swing-trading.
2. New 52w Highs / Lows
This indicator is still way below 1 indicating that more stockas are making new 52w Lows versus Highs. In a good evironment, you will see this indicator reading higher than 1.
3. Stocks above/below 200d MA
Only 30% of stocks are trading above their own 200d MA. Readings >> 50% indicate a broad market breadth which we currently do not have.
4. Up / Down Volume
Still below 1 indicating that the current market environment is more characterized by heavy selling.
5. Advance-Decline Line
Still in a downward trend. in a good environemtn, this indicator is in an upward trend or at least trending sideways.
6. Volatility Index VIX
Improved versus last week. Now reading < 30% and still falling. Might be a good early indicator that we may have reached a market bottom.
7. Bulls vs Bears
This is a contrarian indicator. Market sentiment is now less bullish which is good.
8. Margin-Debt
Now reading at 17% and still falling. Also a good contrarian indicator suggesting that we may have reached the bottom of the current correction.

DIA - Wobble TopDiamonds ETF Monthly Chart having a grim start to 2022. Wobble Top with wild price swings over the last five months. Jan 2022 has been the wildest yet.
Monthly chart showing a potential bearish engulfing print. With only 1-day left in January will they save it? Even if buyers do come to the rescue on the 31st, indicators point to DIA ultimately going lower in early 2022.
And while buyers may appear to be exiting in earnest this month, based upon an entrenched "BTFD" sentiment, my take is the real selling is just beginning. It likely won't take too much more pressure/bad news to start a real rout.
The dollar's strength/resiliency combined with JPOW's comments and live market reaction this past week are telling. Expecting at a minimum a quick retest of the recent Jan lows in early Feb, and likely sharply lower into March/April 2022. Long volatility and short just about everything else as the baby will likely be thrown out with the bath water this time. Great Reset Indeed.
Not financial advice.

Patience all morning, now DIA putsI bought puts with DIA around 340. On the daily I want you to notice how %K (green) chops around as %D rounds down and back over 20. While %D is below 20, a good time to buy puts for more downside is when %K is over it (especially if stays under 35). Notice in this recent market drop, the green line went over orange yesterday and is back down today. There is more selling likely to come because %D is still below 20. DIA is also very weak if price cannot close over 341.
On 30m chart, price has been consolidating sideways. RSI has come up to 50 and is struggling to get over it. There is no bullish divergence yet on RSI so I think DIA may go lower, though divergence may not occur. Stochastic %D looks ready to round back down.
On 5m chart, not shown here, DIA is stuck under 200sma and gets hammered down as soon as it tries to go up. In the very short term I am bearish on DIA until I see price get over 341 and the 200ma.

clear as mudclear as mud clear as mud , don't you see it? I think that this is the turning point, a new president could save us after Biden crashes the market for us millenials sake. I need a good recession to start putting the heavy hammer down on investments. Its like surfing but on a macro level.

DIA 305/300 Feb 18 Put Credit SpreadThis is an after the fact trade meaning that I made the trade today and it closed today as well. Unfortunately I did not have time to post at entry.
Entry: 0.50 Credit
Exit: 0.25 Debit
50% Profit in a day. Ill take it!

Time to buy calls, Dow Jones will rallyWith volume this high - see chart - and only in the first hour, there is heavy fear selling. Indicators show a bounce will come, so use less capital and hold through the turbulence. In the time it took me to write one line, $DJI went up over 100 points! I say this to stress that your trade value will fluctuate in a volatile market, so manage your capital!
The white rectangles show when I noticed the stochastic warning of a drop in the market. The market still has room to correct down, based on my views of the weekly chart. I have linked last week's chart, which is bearish. Any calls I buy today are for short-lived relief rally trades.
