timing is everythingi have mentioned a couple times throughout the year that the 4Q is where i expect things to get interesting. i think we are close at bay. one just possible date is sept 2. which would be 360 degrees from the last major sell off.
trade safely and i hope you enjoyed the gains of the bull market. i dont think anyone expected it to bring in so much exuberance.
money can be moved to more inflation based security plays like gold, or corn. some even like bitcoin. i am not all that fond of it.
this is not trading advice. just my personal opinion about what is about to happen from extensive time i devote everyday to charts. i have been wrong before and i will be wrong again. the market has humbled me enough. set stop losses always.
DIA trade ideas
DIA touch of the 50 MAWe had a touch of the 50MA today at the opening today and are positive (for the day only). I am waiting for a close today for any following decision.

DOW THEORY SELL IN PLACE Chart posted shows the Non Confirmation . SIGNAL IS FORMED for A SELL SIGNAL it will remain unless djt can takeout old

Is a 10% Correction in the Market Coming Soon? - DIA | DJIWith all the fear mongering/hype regarding the Delta variant, along with newly implemented mask and vaccine mandates, the idea of more lockdowns is just around the corner. Because of this, I plan on playing this low risk / high reward short setup in the Dow Jones Industrial Average TVC:DJI or AMEX:DIA ). This play is being used slightly as a hedge against any temporary market overreaction/correction. My stop loss is set approximately 1% above my entry point (slightly above ATHs) and the expected target will be towards the 200-day MA. Put options on DIA will be my method as well.
The featured content is intended to be used for informational purposes only. Everything shared here is my own opinion. It is very important to do your own analysis before making any investment based on your own personal circumstances. Please subscribe to our channel if you like what you are seeing!


Dow Break Higher a 'Move of Necessity'For many, a break like the one we've seen from the Dow (here the $DIA ETF) is a 'break' and has set expectations for a productive follow through. However, I think it is clear that general market conditions are not conducive to trend development.
I would categorize the Dow's break from its tight wedge this past session as a 'break of necessity' where the market just ran out of room to move. The technical break is amplified by the thin market conditions and generate what looks like a more ambitious break than what the market is actually willing to follow on.
Ultimately, time will tell with what happens - or doesn't - tomorrow, but I set market conditions above fundamentals and technicals when making trade decisions.

Breakout Dow Jones $DIA breaking out of the 350 resistance zone and continuing the uptrend. Marching on to the 1% fib ext level on the weekly chart to 371, while steadily holding above 350 on average volume, votality from previous weeks movements have allowed the uptrend to slowly build up. Expecting some new highs in the near term

The 6 Principles Of The Dow Jones Theory !!!Hello everyone , as we all know the market action discounts everything :) I've prepared a video explaining the 6 principles of the Dow Jones theory , everything you need to know about the Dow Jones theory is in this video or if you prefer to read i got you :)
The Dow Theory is a trading concept conceived by Charles H. Dow, an American journalist and founder of the ‘Dow Jones & Company’ financial firm. The ‘Jones’ part refers to the statistician and co-founder of the company who also took part in the development of Charles Dow’s concepts. Initially, it consisted of 255 editorials. Dow himself didn’t actually create and name the theory. After Dow’s death, Rea, Schaefer, and Hamilton gathered the editorials, formed the theory and named it after Dow.
Even though it’s more than 100 years old, this is the theory that technical analysts use and swear by today.
The 6 Principles Of The Dow Jones Theory :
1_ The market action discounts everything
2_The market has 3 types of Trends :
The Primary Trend: It can be as long as years and is the ‘main movement’ of the market.
The Secondary Trend: lasting between 3 weeks to several months, retraces the last primary move some 33-66% and is difficult to decipher.
The Minor Trend: is least reliable, lasting from several days to few hours, constitutes of noise in market and may be subject to manipulation.
3_The market trend has 3 phases :
The beginning of a primary upward (or downward) trend in a bull (or bear) market is known as the accumulation phase. Here, Smart traders enter the market to buy (or sell) stocks against common market opinions.
The participation phase, more investors enter the market as business conditions improve and positive sentiments become evident. This results in higher (or lower) prices in the market.
The distribution phase is marked by excessive buying by inexperienced investors. This could result in great speculation. At this stage, it is ideal for investors to book profits and exit.
4_The averages must confirm each other :
Dow, is referring to the DJIA and the Transport Index , meant that no important bull or bear market signal could take place unless both averages gave the same signal, thus confirming each other. He felt that both averages must exceed a previous secondary peak to confirm the inception or continuation of a bull market. He did not believe that the signals had to occur simultaneously, but recognized that a shorter length of time between the two signals provided stronger confirmation. When the two averages diverged from one another, Dow assumed that the prior trend was still maintained
5_Volume most confirm the trend :
According to Dow theory, the main signals for buying and selling are based on the price movements of the indexes. Volume is also used as a secondary indicator to help confirm what the price movement is suggesting
From this tenet it follows that volume should increase when the price moves in the direction of the trend and decrease when the price moves in the opposite direction of the trend.
The reason for this is that the uptrend shows strength when volume increases because traders are more willing to buy an asset in the belief that the upward momentum will continue. Low volume during the corrective periods signals that most traders are not willing to close their positions because they believe the momentum of the primary trend will continue.
6_A trend will continue until on apposite force is applied :
An uptrend is defined by a series of higher-highs and higher-lows. In order for an uptrend to reverse, prices must have at least one lower high and one lower low (the reverse is true of a downtrend).
However, the longer a trend continues, the odds of the trend remaining intact become progressively smaller.
Make sure to Follow and Like for more content
If you have any questions please ask
Thank you for reading & watching .


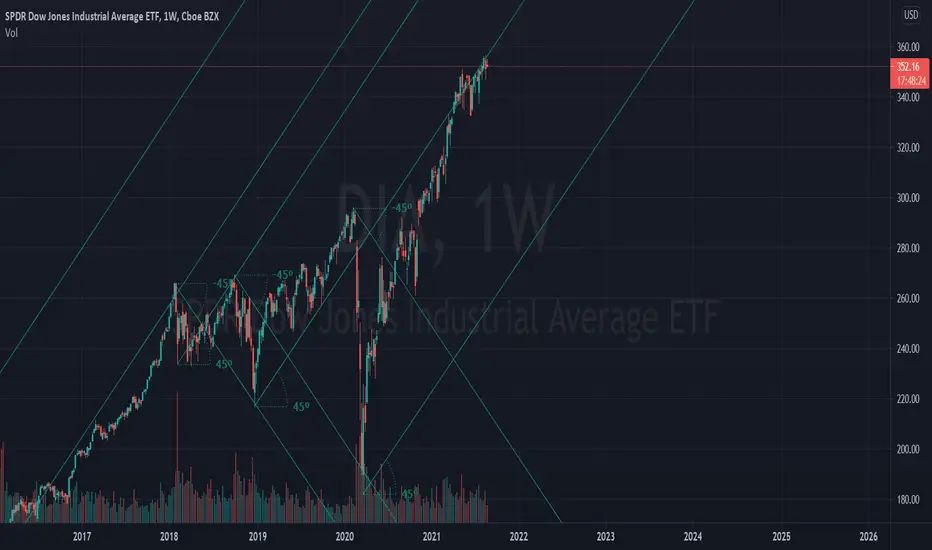
what has happened before will happen again.now that we are hitting another important 45 degree angle, it is time to pause and see how the market reacts to this level. we are at a very dangerous level in terms in valuation but insanity can go on longer than you can stay solvent..... there is no such thing as a free meal. i will be watching 7/10 - 7/12 as a possible date for a reversal. please note that i do not see this as being the big drop... that i think will happen in 4q.....
Here are some things to consider from my cycle study
1) weakening dollar very similiar to what we went through in 1970s with nixon. remember, the first two years of the government printing in 1970s was creating a more robust economy.... until reality hit. there is no such thing as a free meal. standards of living dropped drastically during the 1970s. food sky rocketed by 1973 it was 300% more than 1971. food levels never went down to pre 1970s levels. transitory is a bs story the fed is pushing because they are in a corner.
2) a ban on gold or other currencies that threaten the dollar (bitcoin).
3) oil crisis
4) legalization of marijuana on a federal level
5) space dominance. .... (trains in 1820s.....planes in 1920s.... space in 2020s)
"Although it is obvious that the Keynesians were all wrong and interventionism and central economic planning don’t work, whom are we listening to for advice on getting us out of this mess? Unfortunately, it’s the Keynesians, the socialists, and big-government proponents. Who’s being ignored? The Austrian free-market economists — the very ones who predicted not only the Great Depression, but the calamity we’re dealing with today. If the crisis was predictable and is explainable, why did no one listen? It’s because too many politicians believed that a free lunch was possible and a new economic paradigm had arrived. But we’ve heard that one before — like the philosopher’s stone that could turn lead into gold. Prosperity without work is a dream of the ages."
The Austrians Were Right, November 20, 2008 ----- RON PAUL
"The thing that hath been, it is that which shall be; and that which is done is that which shall be done: and there is no new thing under the sun."
Ecclesiastes 1:9

DOW TOP PREDICTIONThis super cycle EWT & Fibonacci analysis is showing me that we are approaching the top of the quantitative easing/money printing pump. Nearly all of the EWT theory rules apply, and the fibonacci levels are scary accurate. The top of the fibonacci retracement is a projection in this case but the accuracy of the previous trend levels with the fib retracement indicates the top in this analysis. We also have the 2.618 fib multiple within the exact same price range as the projected fib retracement top, which would make sense to be a turn around level on this macro trend.
The top is projected at 36,500-37,500 which is also just before the massive psychological level of 40k, which could suck in retail participants to put the cherry on top of the crash sunday.
Also as an additional flavor, the MACD is at record highs, and we just saw a confirmed cross this is more significant than the ones previously seen in the past 2 years.
I have sold 35% of my holdings, will be selling an additional 15-20% at 36,000.
Look out below...


DIA: Ascending channel, this is why I'm still bullish on marketDIA Still within the channel.
This is why I'm still long on the market.
Price action broke 50MA but still ways from bottom af the channel.
Support around 330$

DIA Looking for Support ?- First commodities, then the miners, then the industrial equipment, then the transporters, then the financials... now the hedges are coming off.
- See support at 320 and 329.
- Ratio says put buildup is over
- Ratio usually double bottoms (hits green twice)

almost done bleeding$329 & $323 are conceivable entries here. $323 PT for me personally. Nice to see some rational profit taking in the big industrials 🤙🏽
Likely just playing this one in the call options through individual DOW 30 names. But the group as a whole needs to bounce, so my alerts will ping off this ETF. I already own a ton of Apple stock, own some call options in that name, my sense is this name will lead the DOW out of its hole.

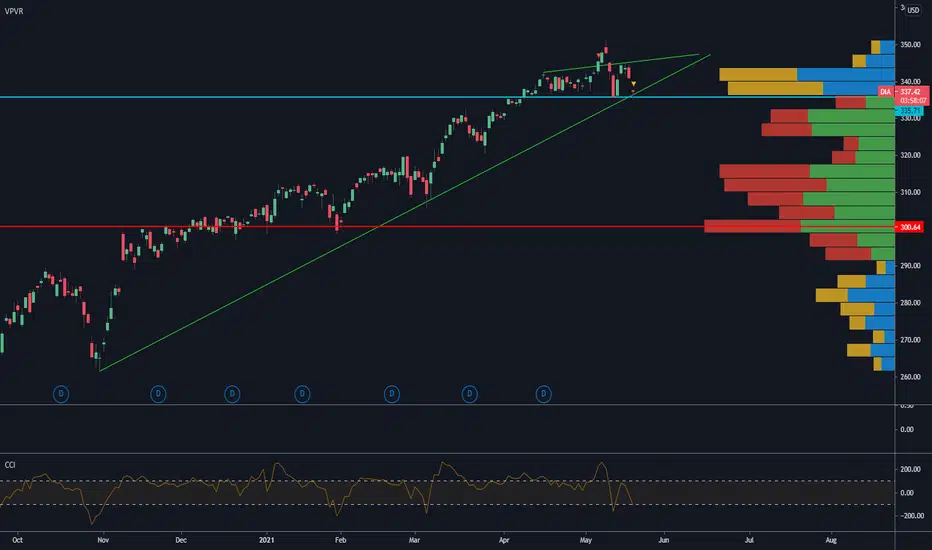
Neutral on DIA...Trend is still intactDIA is in this channel..
if it breaks above or below, trade accordingly.
I am leaning towards short side, but I will wait for that break bewlo $337 to short the market.
Learn, Plan, Size and Manage.
This publish is not an investment advice. I am not an investment advisor. So, you are solely responsible for your actions on your money


DIA a market melting..... up?!This is a great example of a market that is melting.... up. Every day for the past week and a half we have seen a market that opens speculatively higher and closes lower than the open.
If you are looking at markets in general that are healthy you will see that most green candles support an upwards trend while most red candles support a downward trend.
This is very different and cause for concern that there is a large inflationary bubble in the market right now waiting for a moment of sell off.
To be completely honest we are short DIA with contracts expiring June 18th and 25th from the "Out of the Market" phrase large red candle on the chart. This open higher and close lower continually has to stop one way or another.


Overnight Gap is Filled - Probably Rips Higher into Friday CloseCautiously Bullish from here into close and into next week.
(Opinion Only)

DIA - Tested the 50day - Long above the 50dayMAHowever; it hit the longterm trend support. Showing a nice reversal candle so far today.
If holds the 50day MA stay long.