Divergence Confirm Dow Jones ETF MoveThe negative divergence depicted by the MACD on the chart has given us an early warning of the impending downward move. Prices keep moving up but MACD shows declining move. Yesterday, Dow Jones ETF (DIA) confirmed the signal with the gap down move. Likely downward target would be around the 270 support area and the 250 area. A break below the latter support level, might give way towards 200 level
DIA trade ideas

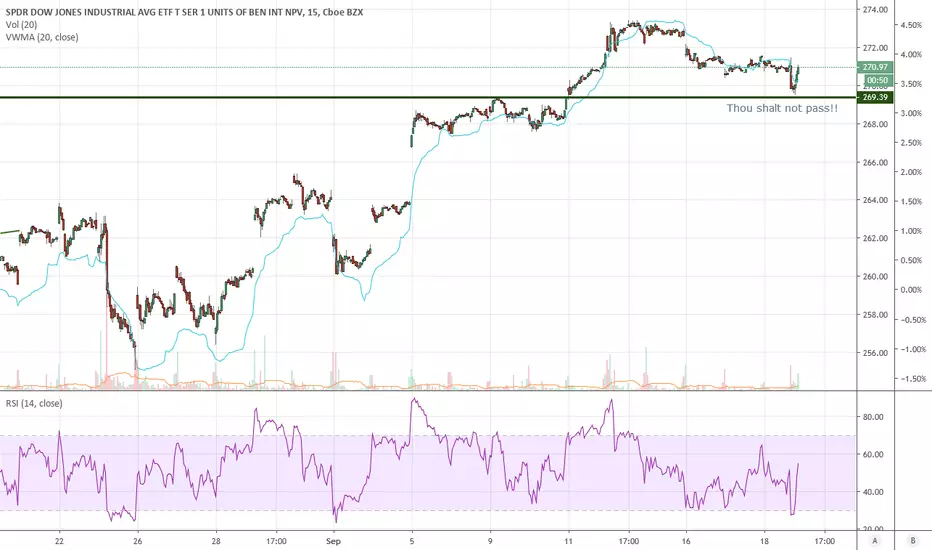
DIA - at the 50 Day50 Day providing some support. This should be temporary as DIA breached the support line which represented prior peaks quite convincingly. Looking for a test of the 200 day soon!

#DJI Dow Jones Industrial Average. How to trap a bullIf the DJI breaks back into this channel, quite a few bulls will be trapped, and we know what trapped bulls do. They sell. Interesting level right here.

DIA ready to correctThis technical analysis was conducted using the Swing•Genie Cycles swing trading indicator on a 2-day chart. It typically takes between 1 and 10 days from the time the Swing•Genie Cycles indicator prints a dot on the chart for the trend to demonstrably change. A green dot is a bullish signal, a red dot is a bearish signal. Swing trades using this system typically last 2 to 6 weeks.
LEARN HOW TO USE SWING•GENIE:
discord.gg
Join our Discord group of Swing•Genie users and learn a system that will improve your trading and increase your profits. Make friends, share information, get ideas, and learn from other growth oriented people. Let's get rich together!
WATCH MY DAILY YOUTUBE VIDEOS
www.youtube.com
Our daily 2 minute video reveals the direction every major index is heading and the gains made since the last Swing•Genie Cycles indicator printed. Like, share, and subscribe!
SUPPORT US ON PATREON
www.patreon.com
Your tips help us make informative content.
GET SWING•GENIE
stockdotgenie.com
Swing•Genie provides novice traders the same abilities as experienced and professional traders - the first time they use it! These professional trading skills often take years for traders to develop. Swing•Genie quickly and accurately analyze stock charts even providing signals that anticipate where that stock will go next, with a very high level of confidence. I have no financial interest in Swing•Genie. I just think it's the best indicator on the planet.


DIA - ready for a pullback?Looks that way to me. Top end of the channel here which has been narrowing for two years now. Decreasing volatility and volume drying up during this time. IMO shorts keeping this thing aloft believing the mother of all bulls has to come down. Trump tweeting everyday that markets are at all time highs and to spend your money well. Something has to give. It's time for a correction.

Trade dimension.looking forward to see a good week ahead, oil to continue coming up, now reaching its resistance zone, as long sustaining the trendline, then should not be the issue to trend.......


Ascending ChannelThe graph shows how the market price observations are contained in a bullish channel, formed by two parallel lines that act as resistance and support, the lines are defined by the yellow circles. The trend line channel offers an overview of the price action in the market.
Temporality in days for the DIA financial instrument that emulates the Dow Jones
August 2018


$DIA distribution? (BEARISH!)The next couple weeks will be very telling of what to expect from the market in the near term. Several major earnings this week and next, once they've been announced...
***Let's talk about it... ***

VERY GOOD DAY! Positive trade talk news. DOW rally higher??Always remember that I am NOT making recommendations to buy or sell ANYTHING investment related. You must do your own research.
YouTube: Dumb Money Trader
twitter.com/dumbmoneytrader
facebook.com/dumbmoneytrader (I do not restrict posts like most Facebook groups do)
www.dumbmoneytrader.com

A NEW DOW RECORD IS COMING THIS SESSION. Disgusted by the medias position on the stock market. All bullshit anti-trump bias. UNEMPLOYMENT RATE IS 3.5% LOWEST IN 50 YEARS (NFP 10/4)
Obama could only get the unemployment rate down to 5%. *sob*
We have a very positive investors sentiment coming into this week. Good unemployment rate, China Trade Delegation arriving at the White House.
RECESSION RECESSION RECESSION!!! Note that when people call a recession this is a business stunts. If they were right they would have a book out and have the ego of a pregnant whale.
TRADE WHAT YOU SEE NOT WAS YOU HEAR OR FEEL.
NO EMOTION.


Short DIAOur Quant Algo has been flashing a short signal on DIA .
Expect the price to go down by at least 3% in next 60-90 days.
** This signal is the result of a quantitative analysis.


DIA not as bad as SPY after todayBlog: www.dumbmoneytrader.com
YouTube: Dumb Money Trader
Thanks to all of my followers! I enjoy sharing my ideas with you.


Dow Jones - Complex Correction Sequence Complete - SELLDIA remains a STRONG SELL
Analysis Method: Fibonacci & Wave Theory
See related idea for past analysis.
A complex correction has completed. The largest 30 companies are facing serious headwinds. I will keep this idea updated with relevant information.
Here is a brief...
GE - Massive Liabilities
Apple - Massive Privacy Concern/Social Concerns
BA - Embroiled in China/737 MAX
CAT - Tariff/Slowing Global Growth
KO - CEO shake-up
DOW - CEO Shake-up
IBM - CFO Shake-up
Intel - CEO Shake up
JNJ - Mislead Consumer about product saftey
JPM - Blockchain
Merck - CEO Shake-up
Microsoft - Blockchain/Privacy
Nike - CEO Shake up
Pfizer - CEO Shake up
Travelers - Blockchain
Visa - CEO Shake up
Wal-Mart - Earnings?
Disney - Iger? Earnings?
;)
Will update.
Cheers.

Dow MFI OverboughtBoth the Dow index and ETF are overbought on MFI, usually indication that it will dip.
The weird thing is that it usually goes higher after the dip, setting up for overbought RSI with MFI divergence. That goes against my theory that the market is going to tank on the Fed announcement. This chart implies that the Fed will cut rates.... hmmm.
SHorting NKE, but not DJI or DIA.

$spy In case you're wondering why we bounced $dia supportbounced off prior high. We'll see if it was just technical or if it holds next day or two.
spdr dow jones retractThe Dow Jones Index has two major support levels at 50% ret and 78% ret, which is a good position to sell after the correction is completed.

Historical Analysis of the DIAHistorical Analysis and Monthly Chart :
The DIA showing Strong Major Bull Trednd with serveral interaction with the Return Line (RL).
Note the Pick in Momentum since February 2016 (or B3), the next Major bottom made above the Major Trend Line (MUT), and therfore showing the failure of the Bears to take the price downward.
But, we dont see strong sign of buyers either.
The DIA is inside big Consolidation that lasted for almost 2 years (since Oct 17).
Weekly Chart :
The Resistance Area between 265.88 - 267.53 Established in Jan 2018, the second attempt to go above that level accured 1 year ago (Sep 2018) and the reaction was very violent and took the price to far down levels.
Since then the price hit the Resistance Area 3 Times :
1) April 2019 - the price got into resistance reaction and made New High Bottom.
2) June 2019 - the price go through the Resistance Area, Failed to continue, and made new higher bottom bellow that level.
3) September 2019 (these days) - the price close above the area last week, but with relatively low volume.
We need to keep an eye on the price this week and look for the power of the buyers, how far they can take the price up (if any).
Notice also the Volume Activity in the Consolidation Area - Pickup on down moves, and diminsh on the Rallies - weakness .
Daily Chart :
The Daily chart does not give us alot of new information.
But we can see the Trading Zone (sort of Rectangle), and the price movement above it.
The Minor picture is Bullish.
Conclusion :
Since B4, the overall picture looks positive.
But the Key for understanding the coming moves relly on the reaction to the Resistance Area, and the examination of the Bulls Power.
Any High Volume Bullish Activity above the Resistance Area, can take us again to the Return Line (RL).
If we will see Second Failure on the Resistance Zone,we need to examine the power of the Beats, and the next areas to look for are the bottom of the trading zone, and B4.1.
If the Bears will act Aggresivley and take the price bellow B4.1, the picture is very negative and the next level is the MUT.
