DIA trade ideas


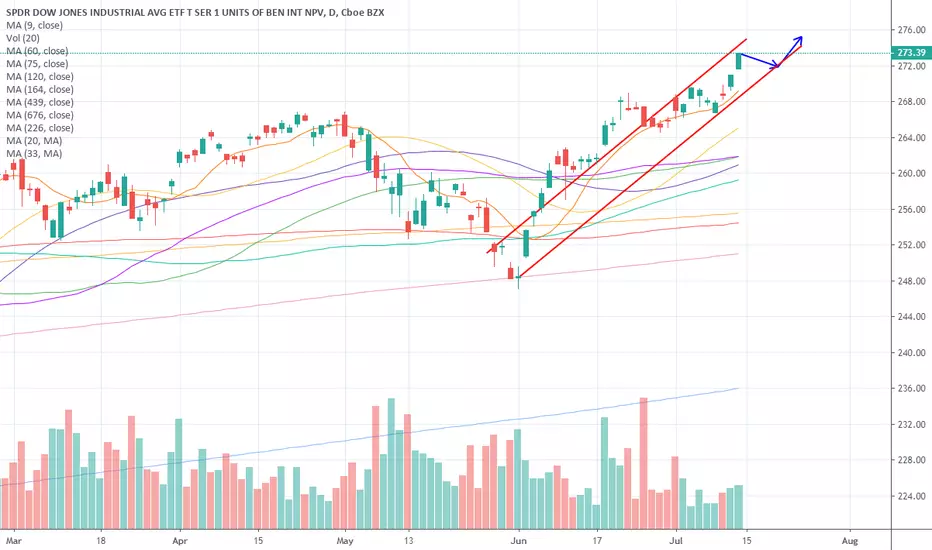
Double bottom reversal? or bouncing on EMA9?Double bottom reversal? or bouncing on EMA9?
Hard for me to say. I incline for the later.

DOW inverse head and shouldersI still think the bull market has another year or two in it. Largest bubble in history is a juggernaut and will wreck all of the shorts. Bear Trap.

Daily DIA stock forecast analysis. 15-Aug
Investing strategies by pretiming analysis
Recommended Positions : Short-Bearish
Price target within 10 days from today : 239.95 ~ 244.19
Investing section : In Rising section of high profit & low risk so far. But it would be in falling section tomorrow
Supply-Demand(S&D) strength Trend : In the midst of an adjustment trend of downward direction box pattern price flow marked by limited rises and downward fluctuations.
Today's Supply-Demand(S&D) strength Flow : Supply-Demand strength has changed to a strengthening buying flow when stock market opening.
Forecast Candlestick Color at tomorrow : RED Candlestick
Forecast candlestick chart of 10 days in the future : www.pretiming.com
Forecast Range % D+1: 0.15% (HIGH) ~ -1.08% (LOW), -0.39% (CLOSE)
%Average in case of rising: 0.70% (HIGH) ~ -0.17% (LOW), 0.54% (CLOSE)
%Average in case of falling: 0.09% (HIGH) ~ -0.79% (LOW), -0.43% (CLOSE)

DIA has generated a SELL signal with Today's Close!Our Proprietary Oscillator has generated a SELL signal on today's close.

Daily DIA stock price trend forecast analysis. 02-Aug
Investing strategies by pretiming analysis
Forecast candlestick chart of 10 days in the future: www.pretiming.com
Investing position: In Falling section of high risk & low profit
Supply-Demand(S&D) strength Trend: In the midst of a downward trend of strong downward momentum price flow marked by temporary rises and strong falls.
Today's Supply-Demand(S&D) strength Flow: Supply-Demand(S&D) strength flow appropriate to the current trend.
Forecast D+1 Candlestick Color : RED Candlestick
%D+1 Range forecast: 0.3% (HIGH) ~ -0.6% (LOW), -0.2% (CLOSE)
%AVG in case of rising: 0.7% (HIGH) ~ -0.2% (LOW), 0.5% (CLOSE)
%AVG in case of falling: 0.2% (HIGH) ~ -0.9% (LOW), -0.6% (CLOSE)

Using the Cashflow Indicator, a downtrend has begun...The cashflow indicator is a measure in change in price multiplied by volume. I believe this shows current interest in changing price. The indicator shows current cashflow and average cashflow. The average cashflow looks like a pool of blood in a downtrend. Each current cashflow value is like a dagger stabbing a cash filled balloon. If you see a blood filled cashflow average this means a lot of selling volume. Basically GTFO!!!!

Bear flag like last winterNot much to say here... Looks just like last winter's bear flag albeit on a much lower time frame. Bounced off critical support today but a close below 271 means 266 in a jiffy. Only the Fed can save the dow now...


Daily DIA stock price trend forecasts analysis.12-JUL
Investing position: In Rising section of high profit & low risk
S&D strength Trend: In the midst of an upward trend of strong upward momentum price flow marked by the temporary falls and strong rises.
Today's S&D strength Flow: Supply-Demand(S&D) strength flow appropriate to the current trend.
read more: www.pretiming.com
Forecast D+1 Candlestick Color : GREEN Candlestick
%D+1 Range forecast: 0.2% (HIGH) ~ -0.2% (LOW), 0.1% (CLOSE)
%AVG in case of rising: 0.7% (HIGH) ~ -0.2% (LOW), 0.6% (CLOSE)
%AVG in case of falling: 0.2% (HIGH) ~ -0.7% (LOW), -0.3% (CLOSE)


DIA consolidation, maybe down before next leg higherDIA consolidation, maybe down before next leg higher

Break and hold could mean long equitiesHard to imagine given the current economic information we're getting but. if this long term fib level break gets through and holds could mean a big push to come in equities.


DIA SHORT based on TOP Resistance + Trend-LineSPDR Dow Jones Possible SHORT over the longer-term coming up, wait for extra signals. Possible SHORT based on the current resistance at 269.20 that hasn`t been crossed yet. Currently low volume trading, wait for higher volume for confirmation on SHORT. I would suggest SHORT ones 1 TARGET(RED) 262.00 is broken (SHORT33%). 2nd Target (ORANGE) 253.00(SHORT66%). If this support is broken look towards 248.00. If this level is broken SHORT full position (100%) until 242.00(GREEN) at least.

Multi year study of the declining influence of the Dow TransportWe are looking at in my opinion the declining influence of the Dow Transport on the Dow Jones industrial average.
In 2017 Id say we saw the peak of it's influence.


brschultz 80%bull/20%bear: Mar16.09 to Apr26.19 to 1Oct.31.2021 Excel calcs a date bottom of 10.31.2021 as bottom based on bottom of March 16 2009 to peak date of Apr 26 2019

RESTATED: Countdown to Market Bottom Oct 2021 Begins NOW!RESTATED: Countdown to Market Bottom Oct 2021 Begins NOW!

My brschultz Peak Model suggests Fed Mtg Kills Mrkts Like Oct 4High probability that Fed Mtg Date is similar to Oct 4 2018 scenerio.
