Dow Jones and Vix Dow is in a nice range and it gives a good opportunity to Buy Vix when it bounces from the resistance line.
DIA trade ideas


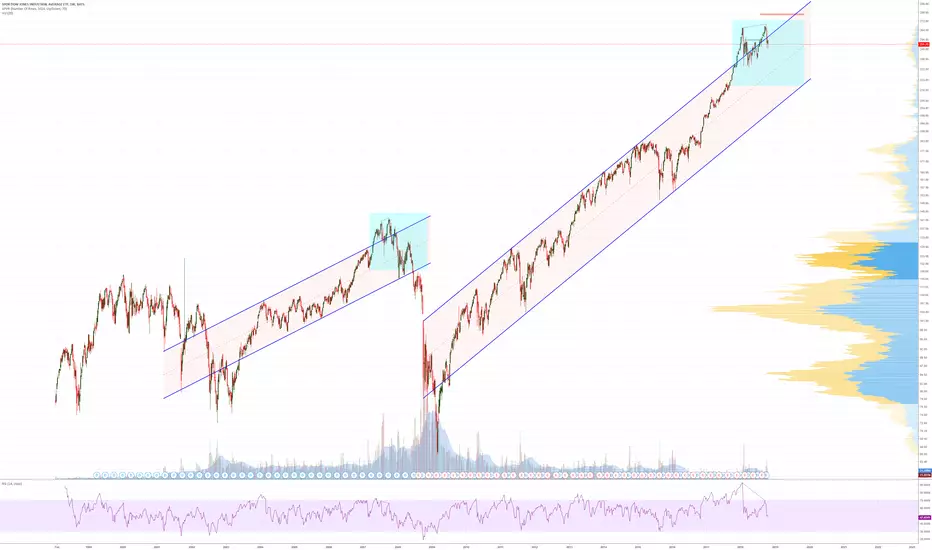
What would a crash look like?The orange lines are all the same, they show the angle of decent in our recent crashes.
The yellow lines are all the same, they show the angle of descent of freefalls during those crashes.
Will the market correction (aka "crash") drop us back to the previous set of trend lines, around the $200 - $220 range?
Would you say I'm crazy if I told you I wouldn't be surprised if it fell all the way to $40?
The 2000 dot-com bubble caused the DJIA index to drop 35%.
The 2000 sub-prime crisis caused the DJIA index to drop 55%.
How much would it drop this time? 65% ?? 75% ?? 85% ??
I extended out the 'crash angle of decent' to see where that'd take us... 2023. WOW!!
What if we look at it another way?
Each crash took us close to the $80 mark in less than a year, before setting a new low sometime after.
I laid out an alternative course with many freefalls landing us around the $80 point a year from the max peak.
The market is influenced by the traders.
Traders are influenced by patterns, therefore the market exhibits patterns.
Will this crash pattern repeat itself? I guess we'll just have to wait and see.


Dow Jones Index is set to bouncePositive closing of the day will increase the divergence between the RSI index and the price. At the moment, the index DJI adds to the Premarket. Closing of the day in with growth will allow to talk about exhaustion of the downward impulse and can precede a substantial reversal in the direction to the growth.
Besides this there are a few things that allow us to remain optimistic about the stock markets, at least for a while. The “Fear Index” VIX has been fluctuating around 20, for over a month now. The new wave of declining markets, instigated on November 09, has not affected the fear of market participants.
The stability of gold prices illustrates the same. Since early October, the gold’s price fluctuations mirror the dynamics of the dollar. Yesterday’s market decline occurred amid the weakening of gold.
The Chinese yuan retains its strength, showing increase since the beginning of the day, which in turn allows us to talk about a partial drawdown of the market, in which some assets have been declining but others have retained their strength.


$DIA LONG IDEALOOKING FOR A PULLBACK TO GET LONG FOR A TRADE. WILL BE FLEXIBLE WITH LEVELS ABOVE AND BELOW
LEVELS ARE AREAS TO POTENTIALLY ADD OR TAKE PROFIT DEPENDING ON PRICE ACTION
NOT LOOKING TO GO HUGE ON A MONDAY DON'T BE AN IDIOT

DIA index is bouncing back from MA and trend line -> BuyHi Traders!
AMEX:DIA index is bouncing back from MA and trend line on the daily chart.
RSI and Stoch RSI are in oversold area.
Price closed above the 200 Moving Average and ascending trend line.
Still on uptrend with recent correction.
=> good long opportunity
If you think this analysis is useful and you want to receive new updates about this idea, leave your comment or your LIKE!
Thank you for your support and may the markets be with you!

What so much FEAR about LOW VIX readings???Let's be objective here:
Low VIX, or volatility, is not a sign in itself of immediate bear markets. Let's look at the last 10+ years of VIX data to find patterns that would suggest trouble ahead.
What we see instead is that the last two periods of extended LOW VOLATILITY READINGS were during choppy to rising periods of the stock market.
No market runs on just one indicator and VIX is just one tool amongst many.
What I see is going on is that people are selling call options to generate income and to cut back a little bit of risk. This is a sign that people are nervous, not bullish. When people are extremely bullish, they "buy calls" and they "sell puts". But they are selling calls and buying puts, which is the opposite of bearish.
Tim
9:30AM EST January 30, 2017

Short targets for DIAI actually forgot DIA having posted setups for SPY QQQ and IWM already.
Same scenario with DIA. First target is at next Trend Factor at 240.17
Final target area is the red box.
Good luck trading guys!

Bearish Channel on DIABearish channel on DIA Dow Jones Industrial ETF) from October 17 and broken on October 30

channelwe can play this channel opening short positions (going with the main trend) and closing when the price
touches the bottom line and also by opening long positions being a bit more riskier. the channel will be invalidated as soon as the price breaks one of the two lines by a close candle not the shadows.


Short DIA has reached Point C of the Cypher patterDIA has reached Point C of the Cypher patter, going down to 0.786 retracement to complete pattern with point D

Be prepared for a reboundAfter a big drop of the DOW, a rebound is very likely to happen. There is clearly a bullish divergence present. Also remind that it's almost halloween which is bullish for the market.

$DIA - One mans trash is another mans treasure. You know, unfortunately, components of the DOW haven't been as gracious of performers as $SPY or $QQQ has been. Last time I posted on $DIA - I thought it was on clearance. Not that I was wrong, but it was more like the chore of cutting coupons before getting any type of deal. Just recently, with $BA, I had the chart & play in mind back from September before the breakout. An 8% move from there was on point enough to not complain, but the weakness behind it stood out enough not to get greedy. Same with $HD right after it hit ATH's. The persistent buyers will argue about earnings - when in reality, I think DJI movers are the ones that'll see their margins get hit. There's a fucking Christ load of tech movers that aren't even profitable? Not that their margins will get hit, but some people have no idea or sense to realize that the company's interest expense is growing at a faster rate than their net income (if they have any) - but analysts don't hesitate to upgrade a tech mover ($CRM, $NFLX, $SQ, for example). If rates are what everyone's worried about - some people are still so complacently bullish that they wana "buy the banks!" Yet, they haven't come to the realization financials like $C, $GS, $WFC, are underperforming emerging markets + China's $GXC ETF. The next rush to Gold ($RGLD, $ABX, $NEM) could be coming soon. & I don't wana sound like a perma bear either - but there's a lot of answers I had to find that even the real perms-bears don't / can't answer. The market is in more of the same debt crisis we've been in since 2013 (except w/ rates actually increasing) than a "bubble" like 2008 or 2001. Moral of the story - shopping in the clearance section doesn't mean you're actually getting a deal.
But that $BA chart -

DOW fractal repeat of 2008? let's see how markets fan out over next 6-9 months and whether this is indeed the beginning of larger consolidation and correction...
keeping an eye on weekly chart time frame and note both bearish divergences in dotted lines.
DOW Exhausted.Seems like the volume on the last bull push was exhausted. Should see 260 soon! Then lower!
Coming from the same guy talking about AMD going from 3$ to $20 by 2020. The same week I picked out NVDA at 27 a share!
Gut has treated me right....

Scalper - DIA - 15m chart - Oct 18, 2018Based on my proprietary indicator (in testing mode):
Long
Entry on green arrow
Exit on red arrow or stop loss or target hit
Short
Vice versa

