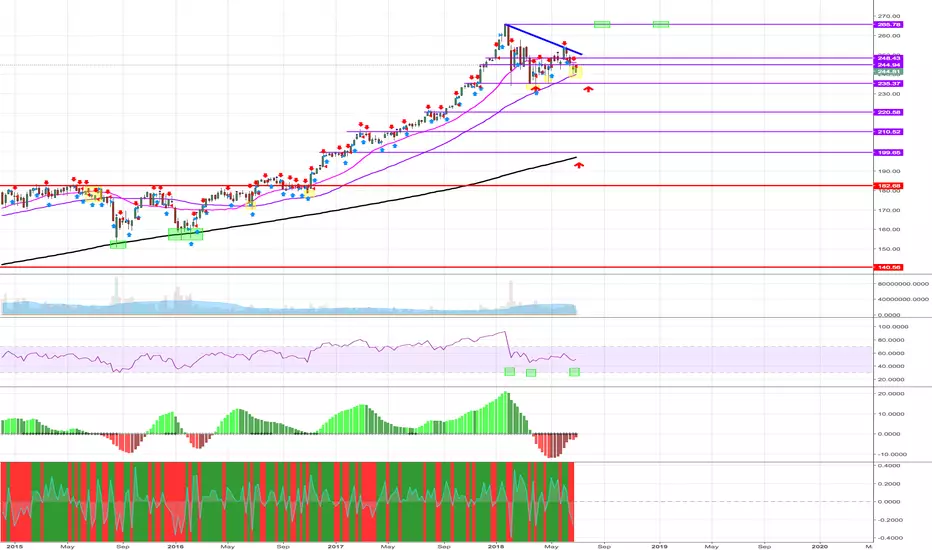
DIA even the short term trend positive yetIt was one horrible week and the DIA held out the best. Despite the DIA loosing momentum the trend is till in tact. If we see a bounce the DIA should lead. So far DIA only gave back OCT inventory. Despite the carnage this week, DIA is up for the quarter. Trends are in tact and this should be a bounce point.
DIA trade ideas


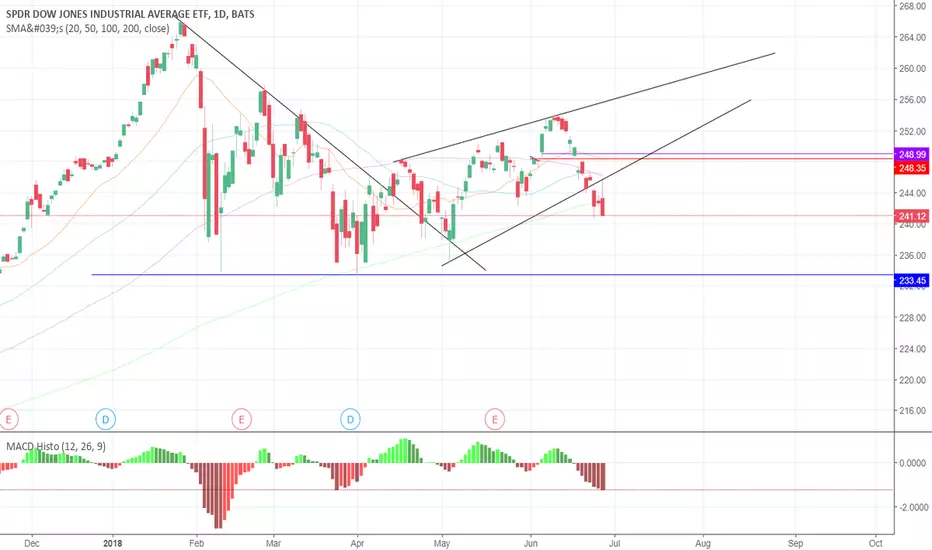
DOW Trade PlanShort Between: 265.00-267.00
First Target Level: 256.00-258.00
Second Target Level: 250.00-252.00
Stop Loss: 268.00
Strategy: Daily Resistance Level, Double Top Pattern.
Risk/Reward Ratio: 1:3

DIA Confirms Resistance Breakthrough -- Market BULLISHAs stated in a previous post regarding AMZN's breakthrough, it is necessary for the price to display a confirmation movement in order to be qualified as bullish.
Looking at the circled area, it is very evident that this confirmation was made today as DIA bounced off of the previous resistance directing itself back upwards.
It will take a week or two for a steady support curve to be established, but I would certainly expect bullish activity for quite some time.
(Given that no major political plays come into perspective.


DIA speculation over the next 10 daysPeak on 9/07 then a dip starting the following monday?
What do you think??

Indecision Rsi indicating over bought. indecision with the Dragon fly Doji but look to the mother ship for direction.


DIA broke out of 100 days high last weekDow Jones AMEX:DIA DJ:DJI broke out of 100 days high last week. Perhaps a pullback next week.

CHINA RED FLAG TO world marketschina has entered bear market
not a good sign
apple is china,. boeing is china, lots of dow jones 30 are china,
nflx crap only hope is china
plus china is holder so f 1 trillion us debt, can offset in times of trouble

Be very cautious when listening to the Financial Media.I really can't stand most of the financial news media. They are seriously like a pack of lemmings just following each other around mindlessly. Personally, I think that CNBC has probably lost more money for people than Madoff and Ponzi combined.
Let me review the news of the past two weeks with regards to the so-called 'Trade War'. 'Markets fall on trade war fears', 'look how bad the market is acting because of the trade war', 'Markets roiled by trade wars', 'Trade Wars this, trade wars that, BLAH BLAH BLAH BLAH!!!...' The Fake News Financial Media wants us to believe that the world is coming to an end yet again.
But guess what? Since the President announced the $200 billion of trade tariffs against China on June 20th, the Dow Jones is down a total of -.58%. That's basically unchanged. Look at the action back in April and May. It looks much worse than the past two weeks have been. Do you even remember what was happening then?
The point is that probably 95% of the time market moves are not driven by news. The main things that cause markets to move are underlying trends, the levels of supply and demand that exists at certain price levels, and random noise.
Prices in markets are always doing one of three things. Going up, going own, or staying the same. When they are going up, the forces of demand are overpowering the forces of supply. When they are going down, the forces of supply are overpowering the forces of demand. When prices aren't moving the forces of supply and demand are equal. These trends are fractal in nature, meaning that there are trends within trends of varying time horizons.
And there are certain levels that are more important than others with regards to the amounts of supply and demand that exist at them. There are certain levels where there is so much supply that the forces of demand can't break through them. These are resistance levels. And there are certain levels where there is so much demand that the forces of supply cant break through them. These are support levels. Often times, trends stall or reverse when they reach these levels.
There is also movement that is caused by random noise. For example, say a client of Fidelity needs cash and they sell $200,000 worth of their mutual fund. Then the traders at Fidelity would need to sell a basket of securities that are in the fund to raise this money.
Now suppose that at the same time a different client deposits $100,000 into the same fund. Now the traders need to buy a basket of the same stocks that they are selling! This dynamic will cause these stocks to move and it has nothing to do with fundamentals or trade wars or what someone on CNBC is saying.
The trouble with the media is that when these dynamics occur, they always need to try find some sort of story that is driving it. The media is in the entertainment business and not legitimate journalism anymore. If the market happened to hit a support level and rebounded at the same time that the Trade War was announced, the media would be saying that the market is up because stocks will benefit from a Trade War!
If you hadn't looked at the markets and just listened to the news over the past two weeks, you would probably think that equity markets crashed. But in reality the Dow is only down -.58%. The lesson to be learned here is that you should have the confidence to shut the news off and think for yourself.

warning warning broke the 200 big time bearish if GDP not amazing we are going to have a big problem
$DJIA Another 1000 points drop comingLooks the weakest index. Next stop about 23K. If close above 24.5K then call negated.

DOW winterHas winter arrived in US equities?
DOW has touched 3 std dev from 52 W
RSI is highest in 30 yrs (quarterlies)

Swing trade for DIAFor people asking me about swing trades. When it gets over my enter line this would be a good entry for a swing trade. I like the bounce off the 200MA. I like the bounce off of most 200MA as long as it's below the 100MA. Remember to look at the long term moving averages and make sure the set up is 100MA is over the 200MA for most, not always but most times to get in off the 200MA indicator. TREND IS YOUR FIREND

buy diavery nice pullback from that huge drop, after 6 day decline we are looking to move up to the 251 area, so be ready to make money tomorrow!!!!!
#usbinaryopsignals
#futuresalerts
#waltervera


HOPE OR FEAR? Observation of Muni Bond etf $LEO vs $DIA DJIAHere's a big point... HOPE vs FEAR as shown by Municipal Bond Prices (using the Dreyfus Muni Bond Fund ETF $LEO)
Hope is the time when people are selling their "SUPER SAFE MUNI BONDS" to invest in stocks.
Fear is when people are buying SuperSafe Muni Bonds
It's a general-view, but worth attention.
If $LEO turns down, then look for the market to turn up for another leg-higher.
How to put this chart combination to work specifically is difficult, but you can at least see the waves of HOPE and FEAR (for growth in the economy).
The talk of tax cuts got the hope UP and then the realities of how difficult it is to make a change to the tax law put a halt to that hope.
Normally, I am watching the $SKEW index and $VIX to determine the general mood and it is showing good reason to be cautious here.
However, the amount of fear as shown by the price of $LEO moving up is giving me the idea we still have more upside in equities.
Call me a nervous bull. There are major rotations going on in sectors here with highly overbought and overowned internet-tech stocks at lofty heights of valuation and lowly valued, cheap stocks to own too.
What category do you put yourself in? And if you answer, what % of your portfolio is invested in equities?
Tim
9:49AM EST July 6, 2017

