DIA trade ideas

LeBron James Sides With Bulls, SPDR Dow Jones Industrial AverageBack in 2003, as the US economy was coming out of a recession, the markets were slowly trying to get up off the mat. The tech wreck of 1999-2000 had sent the markets into a tail spin and all the major indexes suffered substantial losses; including America's sweetheart index the Dow, represented here by the SPDR Dow Jones Industrial Average ETF (NYSEARCA:DIA). So, while most people were looking at improving economic data and low interest rates as the reason for the turnaround, I was looking at the emergence of LeBron James.
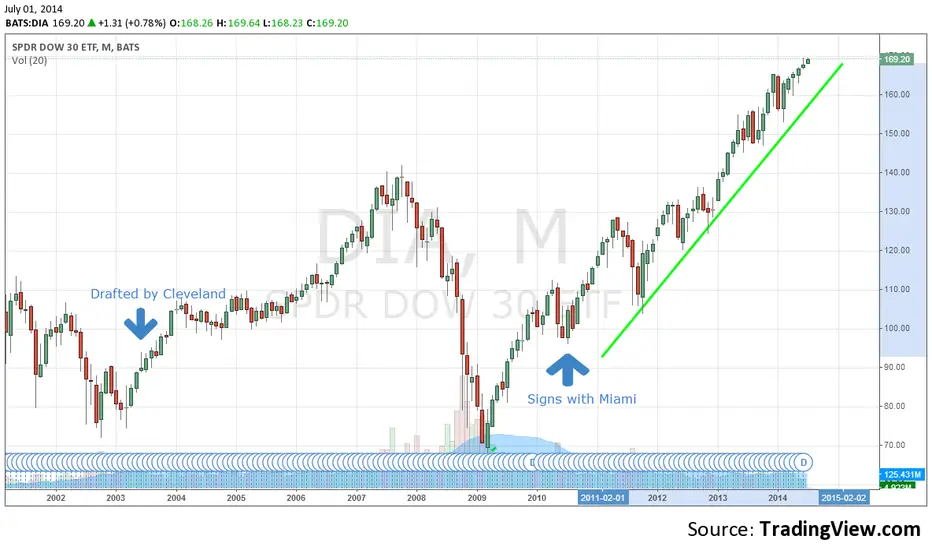
Many of you are probably scratching your head and thinking, what is this guy talking about. Well hear me out, as some of the facts are quite interesting. On June 26, 2003, "King James" was drafted by the Cleveland Cavaliers. That day the Dow had a closing print of 9079.04. Over the next few years as James started to hit his stride in the NBA, the markets moved up higher right alongside the basketball phenom. In the 2006-07, LeBron James was playing the best basketball of his career to that point, and lead his Cavs to the final. They eventually lost out to the San Antonio Spurs in four straight games. Then a few months later on October 11, 2007, the markets topped out with the Dow closing at 14015.12. Over the next few years James would continue playing for his hometown Cleveland Cavaliers, but would not reach the finals again, and the markets would not reach those lofty levels during that same period.
In the summer 2010 King James was a free agent and speculation swirled around what team he would choose and on July 8, the much anticipated "DECISION" was announced. The basketball star was taking his 'talents to south beach' to play for the Miami Heat. That day the Dow had a closing price of 10138.99. So from the time LeBron was drafted, to the time he switched teams, the markets had gone up just over 11%, which is a bit uninspiring considering it was over 7 years.
So how did the bulls of SPDR Dow Jones Industrial Average ETF (NYSEARCA:DIA) feel after the superstar switched teams? Since the day of the historic move to Miami, you could say the markets really began to "HEAT" up. The Dow has blown past the previous high water mark of 14198.10 and gained nearly 70%, and seems to be hitting new record highs on a daily basis. After seeing this interesting correlation between LeBron James and the stock markets, one has to say that it won't be just the basketball world who is awaiting the free agent's decision. While it might be far fetched to say that LeBron has any effect on the markets, it is none the less interesting to note the timing in certain events.
Would you place your market wagers on the direction of Lebrons career? Comment and let me know your thoughts. Either way, as smart traders and investors we know there is always a great trade waiting for us; all we need to do is keep the odds in our favor.
Come step inside the Elite Round Table and take advantage of the market moves and live trades when we initiate. Within the Elite Round Table we provide members with first hand access to our detailed trade alerts via text and email so you can take action on the go. We look forward to having you join us as we navigate the markets and make money!
Parm Mann
Elite Round Table
Follow me on twitter: @ParmMannTrader
Join the Elite Round Table on Facebook
do i have to republish an idea i just found some improvementr i yes, i wish i could edit an idea i just published. i believe it's a natural human instinct to improve on something i just realised i should have done differently...

A study of long term patterns in the DowThese projections are for comparison purposes only. Every next top has previous ones projected as colourful dotted lines.

Dow - bearish divergences finnaly confirmedI have been posting charts with bearish divergences for the past months, waiting for a correction. If I would go with the flow, I would have made a nice profit, but lack of experience plays its hand. Finnaly, the bearish divergence is confirmed by the downtick of the histogram. Both Force Indexes, which I use independently (each one giving a different perspective) are in a very ugly bearish divergence. The longer term FI, has a double class A bearish divergence, while the small term FI used for precision and small swings, is in a multi peak divergence. The MACD lines post a double class A bearish divergence, while the histogram clearly points out the lack of steam from the bulls. Volume is not working, no idea why, but looked at it last night and seemed very light, but I'll have to look again.
Target for the correction is the second strong support at 16000, which conincides with the value zone of the Dow, and further down the 15500 very strong support level. At 15000 - 15500, I would start getting really bullish. I'm not looking for the end of the bull market, but only for a correction. The only time when we'll know we are in a bear market, is when bears are going to be in full control. Until then, trend is still up, look for longs after a correction.
Daily doesn't give any signal yet, so I'm just waiting for now. If this divergence failes, then I think the market is in gear for at least another 1000 points over the last high.

Dow - Divergence analysis 3Everybody is bullish on the stock market, but are the bulls that strong? An in-depth look with the help of oscillators say no. This is a very annoying market, with daily swings that have no logic whatsoever. This is the fourth false breakout in 2014. This fact rules out the option of getting into a short right now and riding it to 15000 or even 14000. What I am going to do is wait for a daily strong sell signal, like another bearish divergence and a false breakout.
Analyzing the chart, there is a clear uptrend going on, and after a crazy rally, the Dow retraces to the EMA Wave. But where is that crazy rally in 2014?? The price deviation from its EMA is very shallow. The MACD lines continue to be in a massive double bearish divergence, first a class A, then a class B. This is toppy behaviour. The MACD histogram had a very nice run in the beginning of 2013, and a smaller run at the end of 2013. Where is the power of bulls right now? There is no clear downtick to confirm the divergence, but by the time there will be one, it is going to be too late to jump in, as this is a weekly chart, and we are still in an uptrend. The point is we need to anticipate. Think about it ; in order for the Dow (and it's the same picture as in Germany, Spain, Australia, France)
to clear this bearish divergence, it would have to rally to about 20000 ( this is just an aproximation, theres no way of telling). Now, how likely is the Dow to rally to 20000 till the end of the year or the start of 2015, compared to correcting to 14000 - 15000 in the next few months, and clearing up this ugly bearish divergence?
Now the Force Index. First the longer term FI, coloured in blue and circled in green. Look at that huge class B bearish divergence. Why would you buy this?? Yes sure, I may be wrong, and the Dow might rally 1000 points this week, but why would you buy this? The second FI, coloured in red, is used for entries and finding short term weakness or strength, that is how its creator, Dr. Elder uses it. The bearish divergence is going on for months, and Dr. Elder said once that what he really likes is 4 peaks on the 2 day FI, each one lower than the other with price standing higher at each peak. Here, the price is not standing higher, but we have 5 lower peaks on the FI. This is extremely bearish.
The daily chart stands at a buy zone, and on Friday the momentum from Thursday was lost. I don't want to enter right now, I want to go in a bit higher. I will wait for a serious signal, as I got whipsawed a few times by this false breakouts.

A little perspective for all the eager bearsNo fancy indicators here. Just good ol' fashioned highs and lows.
Could a top be developing? Sure, but why risk short positions now, when there's no evidence of a trend change?

DIA - upside surprise ?I will still wait conservatively for monthly and weekly time-frames to confirm any bearish scenario. Look at the clearcut price action 2007 - 2008 and compare this to now. We have all the time in the world, picking tops is for amateurs....:-)

The Dow - Crack allready!!!Global markets are getting more annoying with every day that passes. The conflict in Ukraine is not helping because it brings volatility to the markets, especially the European markets. Correlation between major global markets is very strong, and who ignores it and analyzes markets indiviadualy loses the big picture. Weekly charts show ascending triangles, but all markets are losing momentum with each rally.
Yesterday's reaction after Yellen's speach was terrible, bringing confusion. Today, the exact opposite. Price rallied, and by the end of the day pros got prices lower. This happens all the time after big events, the first reaction is done by the amateurs, but after the pros come and close the day.
Another false breakout over 16500, another divergence, with the Dow in front of the other indexes. The Russell leads the fall, followed by the Nasdaq. I keep saying this in my posts, because it is a very important warning signal.
The rallies are getting weaker and weaker, shown on the chart using deviations from the moving averages. The MACD lines are still in a bearish divergence, with the histogram losing strength each time price rallies, and a bearish divergence on the Force Index.
I am short the Nasdaq, because I figuered a position there will be more profitable than on the Dow, because of the bubble stocks included in the calculation of the Nasdaq.

DIA and XLB confirmed SHORT to test Bollinger Band and moreBlown 20 day moving average (shown) and important Algo lines on Weekly and daily charts (not shown) DIA and XLB are crowning... 3 points..on DAILY. often tops. MORE Market drop coming, but huge moves take a number of drops and pops as market churns, then,,, after a false run up... vicious down. See 2011. Based on the market fundamentals like QE free money and ridiculously low interest rates, that may not happen, but a test of 16K is coming and them a test of the 200 day MA at 15700ish.

The Dow - Divergence analysis 2Please first check the tagged chart "The Dow - Divergence analysis". You can see there the reliability of all these bearish divergences. On this chart, only the latest divergences are labeled.
I am short since Monday on the US stock market and major global markets, and now the weekly confirms my bearish bias, with a very ugly pattern.
First of all, price formation. A double top formed with divergence on the MACD lines and Force Index (which includes volume!), and last week there was a retest of that double top, with a false breakout, with a gravestone doji. That's bearish enough for me, considering this is the weekly chart.
The MACD shows three bearish divergences, one that includes the year end rally, and two for the double top.
You can see a huge class A bearish divergence, which I believe didn't play out yet. There was a strong reaction two months ago, but not enough considering the size of the divergence. After another push, a class B bearish divergence formed with the double top. This is one of my favorite patterns, for reverseals or strong corrections, class A followed by a retest of that level with a class B. Furthermore, there is a huge bearish divergence on the MACD histogram. Look how little power the bulls had with this last rally. All these divergences for me point to a very bearish short term future.
Let's take a look at Force Index, which works here cause we have volume. The double top came with a bearish divergence also on FI, and with this last rally there was no cross over zero. This points out how strong the bears really are. The level at which we find the Force Index today is the lowest since the start of 2013!!!! This shows bear power!
The EMA wave shows value, and when price gets close to value, it's good to go with the trend. Right now there are no bullish signals, neither here, nor on the daily, so I will be looking for a further decline.
Please look at the pattern described on the chart *!! which I think is very important.
If we analyze candlesticks, last week there was a gravestone doji star, a very strong reverseal candle, especially on weekly charts. This week, a closing marubozu that broke local support.
Support levels are labeled on the chart, and those are the levels to watch for the end of this correction. I am looking to add to my short using the daily chart.

DOW - Lowest volume since 2006Update : It was a delay problem, volume is 6 milion so the chart is pointless.
This is more of a personal chart. There's no trade ideea, just a chart that maybe I'll want to look at in the future.

SPDR DOW 30 ETF - Divergence Back at the High vs Russell2000 IWMThe old market saying that when the Generals (Dow 30) leads the army (IWM = Russell 2000), then watch out.
I realize this didn't pan out back in January-February before the big decline into the February lows, but that is what you get with old market sayings. You win some, you lose some.
Define your risk and study it after you exit, then revise if necessary and trade on.
Cheers,
Tim
4/8/2014 8:43AM EST

Fibo Gann Elliot analysis 1 year forecast $SPY $QQQ $IWMMajor US indices moved higher over the past week after favorable employment and manufacturing data.
Looking at technical indicators, I see the divergence between price and indicator which is a bearish sign.
I will be watching for a number of economic indicators due out over the next days, including unemployment data on April 4th, FOMC minutes on April 9th, jobless claims on April 10th, and Producer Price Index (“PPI”) data due out on April 11th.
Proprietary trader,
google.com

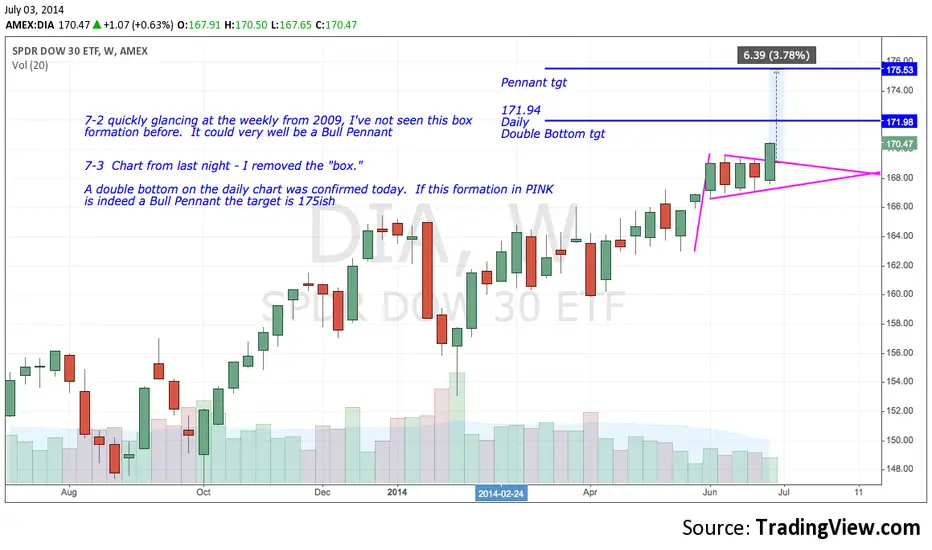
REPUBLISHING 2014 FORECAST UNTOUCHED WEEKLY DIA SPDR DOW 30 ETFThe market is still going along the general path of the forecast so far in the first quarter. The market held the key support level that I labeled as the green box. And the market is peaking at the general area where I have expected resistance. Technically, the forecast is going well. Fundamentally, not much has changed.
Overall, the market is overcoming the negative news headlines from around the world. Corporations are simply profitable enough with the highest profit margins in history, but they are leveraging their collective balance sheet and buying back stock, which will inhibit economic growth long into the future. The recent tax rate hikes generally will keep a lid on any upside progress this year while at the same time money continues to "asset allocate" out of bonds and into risk assets. Real estate is benefitting from the flow of funds out of stocks and from the artificially low interest rates provided by the Fed's machinations.
From what I have heard through the grape vine, people are using their margin accounts to buy real estate so that means the market is truly vulnerable on any price shock because there aren't as many stock certificates to sell by margin departments to reduce margin balances in the face of a market slide. So, the highest margin balances in history right now are what has me most concerned and gives me the expectation of lower prices for stocks going into year-end.
The low level of Gold and Silver is an opportunity to buy, in my opinion. Gold and silver and commodities have been suffering from a variety of news in their bear market. The stock market is suffering from high energy prices also which will keep a lid on prices with a 3-6 month lag.
To summarize:
Bullish: Asset allocation out of bonds to stocks. Stocks still the only game in town. High profit margins at corporations. Stock buybacks (and Mergers & Acquisitions) are all supportive of prices.
Bearish: High valuations leaves little room for error. Earnings are not spectacular. The economy is flat. High margin balances. Corporations leveraging and not investing in real assets. Low VIX signals complacency. The Fed easing off the money machine throttle.
This is a good time to sell calls against the market for the balance of the year. Yes, low VIX and high prices are good times to sell calls (in the money) to take advantage of sideways to lower prices for the balance of the year.
Regards,
Tim 4/4/14 10:29AM EST

DIADIA still has to fill the gap created on March 17, 2014. When it does, do not be surprised to see the lows of the year tested.

DIA possible bearish reversal at small Gartley patternThere is a small bearish Gartley Fib Pattern in the DIA that could present itself as a very unique selling opportunity during the remainder of this week.
SOMETIMES very small bearish Gartley patterns nail very important final tops in markets and stocks.
However, important confirmation needs to present itself in the form of price candlestick signals assuming we move up into the 164 zone.
If we do get into 164 zone then look for candlestick price reversal signals.
End of month, end of quarter 'window dressing' may create small upward bias into end of this week.
So if all goes according to plan we should start to see a key bearish reversal from this small bearish Gartley late this week or early next week.
Early next week is indicated to be a panic cycle week according to Marty Armstrong and the following weeks after next week are indicated to be high volatility.
This small bearish Gartley pattern may be nailing a very unique top and shorting opportunity in 2014 !!!!
but needs confirmation at the 164 zone of clear reversal !!!!
The fly in the ointment with this type of potential pattern setup is that if the DIA exceeds the 164 with confidence on a closing basis, then the situation could turn in the exact opposite resolution (extreme upside market breakout and strength).

SPDR DOW 30 ETF DIA IS BOTH AN UPTREND & DOWNTREND SPDR DOW 30 ETF DIA BOTH UPTREND & DOWNTREND
Wednesday 3/19/2014
There are two trends in place since the market is above the 10-day mode at 161.50. The 10-day mode is now 13-days. Why? Because 3 more days have accumulated at the 161.50 level and now the market has disconnected from 161.50 by trading, on Tuesday, completely above the 13-day mode.
If you currently have no position - You can go long here at 163.45 with a stop and reverse at 161.50 so that you go short at 161.50.
If you are already short: The downtrend is also in place but today is the last day of the downtrend time. The market is also below the two-mode areas labeled above at 164 and 163.6-163.18.
This is how a market "balances out" after a period of strong trending action. A market isn't always going to "trend" and allow us to pull endless cash out of it.
Let's hope for more big trends but I am fine if there isn't one for awhile.
Tim 10:36AM EST 3/19/2014

DOW JONES SPDR DIA DAILY FAILED UPTRENDThe downtrend from the January high met all normal "trending" characteristics and guidelines.
The uptrend from the February low so far has failed the general trending guidelines and has failed to rally in price or in time that suggests that the market is NOT ACCUMULATED and rather is IN DISTRIBUTION at the current level.
The 163.18 level is key resistance and only if the market can climb above this 163.57 level will the uptrend be re-confirmed.
A healthy market will rally for 10 days from a 10-day accumulation. Time runs out today on the uptrend, which means that at the end of today if the market is below 163.18, it is wise to go short and place a stop above 165, while looking for a drop down to the 158 level (the last consolidation).
Tim 3/17/2014 10:18AM EST 162.39 last

The Dow about to start another bear leg?The fib target is based on the current high of this week's candle, it is subject to change as price changes. I used the AB=CD method to find the next leg's potential target as well as trend lines and possible elliott wave count.

DIA - Second leg down below the outside candle?We had a very strong pullback after the recent selloff followed by a large bearish outside candle. Perhaps another leg down is coming. With targets at the unfilled gaps below and a stop above the high of the outside candle we get R/ R ratios of 1.3 and 3.

TESTING OF LOWER MEDIAN LINE PARALLELLet's wait for EOD to see how price reacts to the lower median line parallel.
A break below this lower median line parallel means a bearish market.
If we see a nice pin bar formed, there is a chance of a possible reversal back to the uptrend.
