DIA trade ideas

Fractallian ForecastTopping (usually) is a process. 1929 an exception to that rule, but even that formation put in a right shoulder before dropping more than 50% over a few short months. Wait for a bounce to gap-fill just shy of 164 to pile onto the short side, stops at all time high.

DIA - Bat Pattern and possible reversal before a second leg downThere is a Bat Pattern coming up in the DIA.
I expect a reversal at the .886 retracement and then another leg down. Should price build a trading range above the .886 level and before reaching it, prices will probably break through it and into the support zone.


FORECAST FOR 2014 FOR DJIA (DIA)For those of you who know me from my previous posts - I have tried my best to draw the outline of the market going 6-12 months into the future. I have merely "cloned" my previous charts and you can see what those forecasts looked like on this chart. I realize it is a bit cluttered on the chart, but I think the relevant points are on here and you can review what I have said "untouched" from before. So, here it goes:
2014 Forecast:
The market has not built enough time up here to sustain a long term rally. But with more time at lower levels then accumulation can develop and the bull market can continue. However, from current levels the market is not on sturdy ground. The market is stretched up at 165 and support is down at 149 and implies a downside risk of 10%. The time of the last consolidation was 12 weeks and we are in the 12th week of the rally. So, time has run out. Since the market has needed 20 weeks of accumulation before each previous rally, it is bearish to me that it only took 12 weeks in this latest accumulation.
The factors driving the market until now have been clear (stock buybacks, earnings growth, Fed driven low interest rates, equity fund inflows), but we are ahead of rational long term valuations and I would not recommend committing new funds to this market.
I am concerned about several areas: Corporate leverage is up. Valuations are stretched as stocks have been top performers. Margin buying is at record levels. Investors are optimistic again. Analysts seem unanimous in forecasting higher prices. Demographic trends are pointing down for several years, implying weak economic growth (See Harry Dent's newest book, just released this week). This is a great time to do the opposite of the analysts forecasting another 10%-15% gains and walk away instead.
A great alternative will be picking individual stocks and getting back in when prices are lower. I'm happy to take the risk of avoiding any further upside to this market. For now, sit in cash and if you have knowledge about put and call options, you can utilize strategies to give away the upside (selling call options) return in exchange for protecting against a move to the downside (buying put options).
Happy New Year to all and here is to a successful 2014 at TradingView!
Cheers,
Tim Jan 9, 2014 12:10PM EST

REVIEW OF 2013 FORECAST FOR THE DJIA by Tim WestOverall, this was a decent forecast of the primary movement of the market for 2013.
The previous year's forecast was also decent and this brings me to 2014 and forcing myself to sit down and weigh out the overall landscape of supply and demand for equities, the levels of sentiment across the spectrum and weigh out which way I believe the market will move for the year.
Cheers to a great 2013 and wishing you all another great year ahead for 2014.
All the best,
Tim
1/3/2014 @ 12:58PM EST


Today's pennant: AM gap up closes at 159.29. An upside measuredmove easily breaches 160. $DJIA $TM_F


PRICE TOUCHED THE MEDIAN LINE AND REVERSEDPreviously on
2913.10.18
I forecasted that price will hit the thick median line before we will see a reversal.
Let's see if it gravitates the the L-MLH as depicted in the downsloping red arrow.

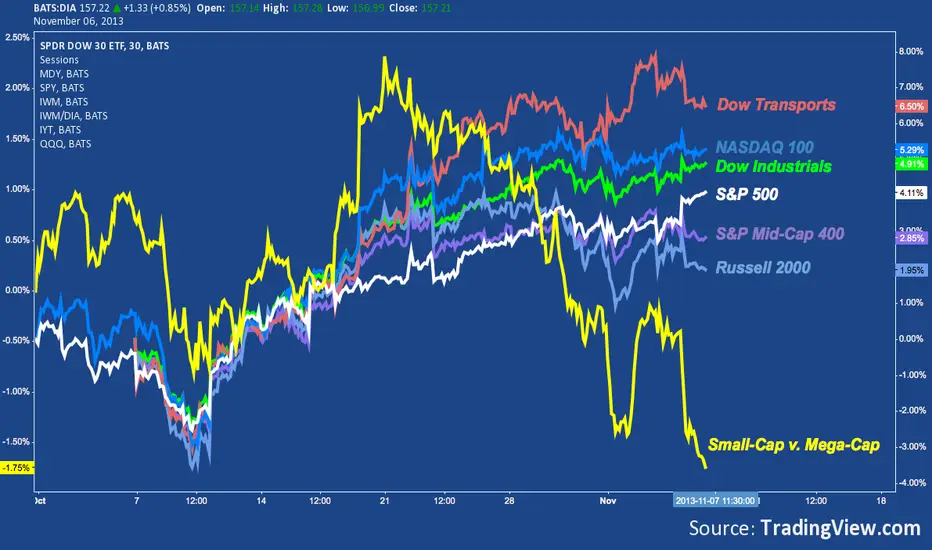
DOW at the top or new bull market, this is the Question!Look at this ratio- if this is bottom than a new bull market could begin - big caps should only start to rise faster as small caps. SOME CORRECTION FROM TIME TO TIME IS HEALTHY:)

SLIP SLIDING AWAYLooking at the touches on the the colored circles you can see how you can catch the top and bottom of price precisely.
The yellow, green and red channels are equidistant or having the same price frequencies. This is defined by using a sliding parallels to capture price frequency when it protrudes out of the pitchfork and failed to reach the Upper Parallel(U-MLH) of the upsloping pitchfork.
Price will be attracted towards the median line show by the red arrow heading towards the ML as circled.
We can expect strong market correction next week as it heads towards the median line. A strong possible down thrust towards the Lower Paralle(L-MLH) is highly probable.
If you are holding any LONG positions, be alert for a major market correction or profit taking this week.
Get ready to short once it is near the ML with the right market action.

Diamonds Monthly Bearish BatI continue to stick to that position and believe that we are in a special bullish cycle despite any impending
news headlines or geopolitical concerns. This is one of the most difficult distractions for all traders. It is natural to want to correlate market price action with a news headline. As human beings, we always want to connect a cause to
and affect but as traders this is one of the greatest flaws. I will remain bullish until 1. These targets are met 2. The pattern is destroyed. This doesn't mean we won't see corrections along the way. I still have a buy the dip mentality. Although I could be wrong just as any trader can be. I will stick to "buying dips" until the market proves me wrong, not a news headline. *I just realized this is a Weekly Chart Oops*


2011 Dow High v. Current Price ActionJust for fun - history rarely repeats but often rhymes. Good luck!

DIA 8/23/13Hammer formed in oversold condition. Wait for Monday to confirm momentum. Need a positive candle and higher volume. Look to test old high and pass it. Stop loss should be support at ~148.
