Opening (IRA): DIA June 16th 280 Short Put... for a 2.95 credit.
Comments: Adding another rung in the DIA's, targeting the <16 strike in the shortest duration paying around 1% of the strike price in credit.
DIA trade ideas


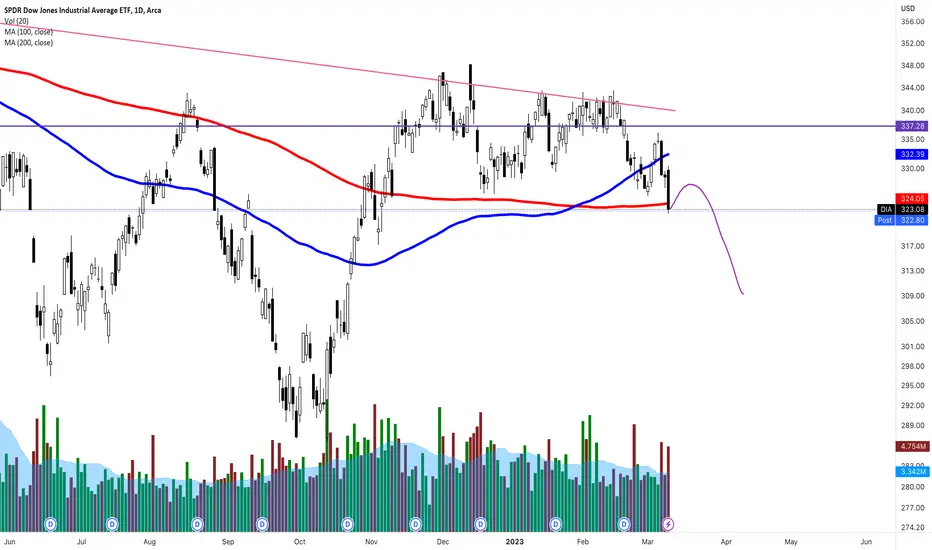
DIA Neutral short term bull, long term bear.Hello everyone,
I have explained my thought process of what could occur in the markets currently. If any of you have questions or comments, let me know down below in the comments.
~MC

$DIA Not financial advise. $DIA
at the bottom of broadening formation 4hr timeframe gap around $299 if we fail to go back to the top of the formation.
Be patient
Thanks Alex!
Remember Not financial Advise!

DIA doesn't look strong MANY warning signals on the DIA.
Chart patterns,
Weekly charts
candles
closing below moving averages..
LOOKS WEAK.
does technical analysis work? dia is wonderingDIA has been stuck in channel and will eventually pick a side.
rates rising, jpowell speaking, will treasuries pull assets form dollar sensitive dow?

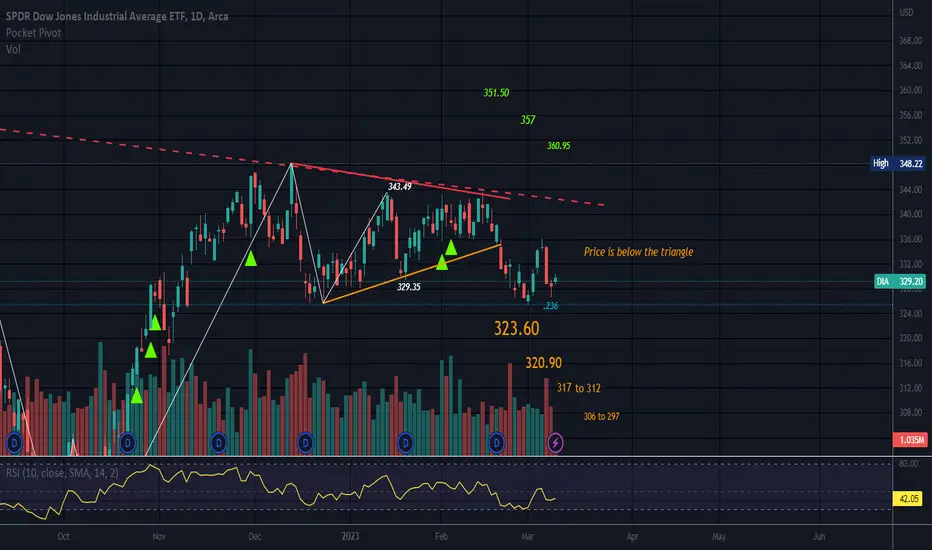
Symmetrical TrianglePrice is below the triangle.
The bottom line is now a level of resistance.
No recommendation.
Price remains slightly above the .236 of the trend up.
Overall trend is Down.
Short 08/03/23 DIAPrice broke a triangle after going sideways, went below the 100 MA, retested, and is now forming a bearish engulfing candle
Asset and Time frame - DIA, Daily-Weekly
Entry Price - 327.39
Exit(Stop Loss) -336.79
Exit(Take Profit) - 293.65
Technical Analysis - Price broke a contracting triangle, made a few undecisive doji candles near the 100 MA, then closed below it, now, price action has retested the triangle and is forming a bearish engulfing candle(depending on the close of the candle), the prior daily candle closed below the daily 100MA
Good luck to all of us

DJIA daily - time for bear pull backDJIA has found support at the BigRed level, just as I analyzed in the last report. It bounced back strongly and nicely and is now close to a resistance area. We will have to wait and see what it does next, but for now, it seems more likely to experience a bear pullback than a bullish pattern.
Volume does not confirm the price action, as it hasn't moved above 20 days average volume. Therefore, this move is considered bearish or a fake move.
The price bounced from the 200-day MA, which is a bullish sign, but it is still below the rest of the major MAs, which is bearish.
The RSI is neutral, and the MACD histogram is ticking a smaller red tick, which could be a bullish sign. The MACD line is trying to cross above the signal line, but both lines are below the zero line, so we still need to wait to determine if it is bullish.
Overall: DJIA broke down from a symmetrical triangle and found support, which is a common pattern. Prices tend to test prior support levels before continuing in the direction of the breakout, in this case, the bearish direction. The price is very close to the 20 and 50-day MAs, which will act as resistance. Additionally, there is a trendline from the symmetrical triangle, which will also act as resistance. Therefore, for bulls, they need to gather strength and break through that resistance with significant volume before I can say it is bullish and we could go up.
Otherwise, I will see this only as a textbook bear pullback after a pattern break and would call a drop below the BigRed level almost certain in the next two weeks.
The sell signal would be flipped to the buy signal only if we cross that resistance area with a strong volume.

Wave C of B low is in place wave C up has startedThe chart posted has now pulled back to the Target low and cycles are now Up and in full force wave C up has two targets 1st is 35185 in the Dow the 2 nd is the retest of the old high . into late march21 to alt date april 2nd from that high the second leg of the super cycle Bear market should see a Crash phase with No Place to Hide. Best of trades WAVETIMER

DOW - Any relief rally is guilty until proven otherwise !Seems to me like this could unfold as a complexe correction if bulls are to remain in power longer term.
We could see soon a move up but if it stays sideways it's most likely going to be a wave (b) of higher degree Y imho.
Look for individual names showing relative strength right now, those are most likely to be the next big leaders.

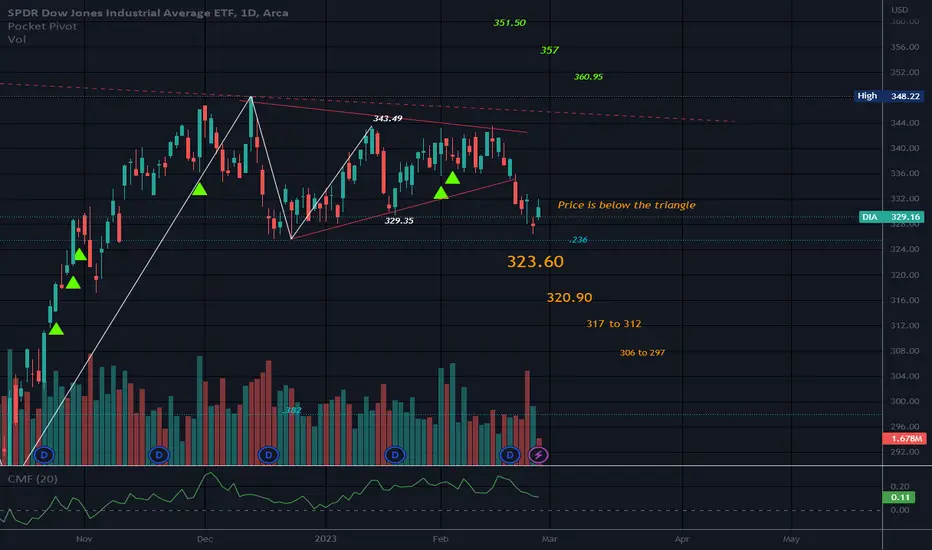
Symmetrical TrianglePrice is beneath the bottom line of the triangle so support has been broken.
Possible M pattern forming.
Price is just above the .236 of the trend up, so in the scheme of things this has not really lost too much ground even though it feels like it has. The intermittent rallies up are making this a very slow process.
No recommendation.
″ I haven’t seen anything all day. I have been trying to climb this rock.”
$DIA$DIA Long Trade Idea
$DIA is likely to bounce off at retest of 200 SMA to upside to continue movement with in the triangle.
My trade plan: Entry 325.65, Stop loss 321.1, Profit exit 339.5 (at top of the pattern and max volume in fixed range volume profile) Risk/Reward 3.03
Not an investment or trade recommendation. Do your own due diligence

Learn to STRATEGICALLY take SOME profits $DIA exampleInvestments tend to fall in value FASTER than increase
(even in bull markets)
IMO always take profits STRATEGICALLY
This works for ALL investments that have tried it on including, but not limited to Crypto, , Commodities, Bond Yields, and Currencies
AVG
1-2 = 3 weeks
2-3 = WEEK!
3-4 = Almost month
4-5 = WEEK!
5-6 = 3 weeks
6-7 = WEEK!
Example $DIA
Use Resistance & Support levels to help with #INVESTING

DIA is the Index to discern the next moveDIA opens the year sitting on the annual pivot but coiling on the weekly and daily. AAPL has broken down longer term, so this suggest downside is more likely. Don't anticipate. Simply participate.

Warning, Warning, Warning! Major drop ahead.DJIA has broken below the symmetrical triangle, indicating the end of the bull market. The price has dropped below the 50-day moving average and trend line with no significant support acting at all. This suggests a weak market with no real buyers while sellers are expected to enter soon. Smart traders are exiting the market, while most retail traders will panic and sell along with algorithmic trading systems after the significant support line is breached, aka BigRed.
The price is currently below all major moving averages, except for the BigRed.
The Relative Strength Index (RSI) is declining significantly, indicating a negative trend.
The MACD histogram is also showing a strong downward trend, with the MACD line expected to fall below the zero line in the coming days.
Overall: after such a strong drop below a significant support line, it is unlikely for DJIA to recover or rebound. Bears are currently taking control, and the price drop could be rapid. However, it is expected that the price will retest the trend line, as it typically acts as prior support before turning into resistance. The BigRed may act as a support, but it is not guaranteed to be strong support.
From a bullish perspective, traders would need to step in and buy today, pushing the price back into the symmetrical triangle. If this occurs, it would indicate a false breakout, and the market could be ready to explode to the upside. However, the probability of this scenario is below 20%.

DJIA fall out of the symmetrical triangle, sell signal confirmedDJIA was in for a long long time in this huge symmetrical triangle and wasn't able to move in any direction. Now it's finally dropped out of it. Will it stay out and have a huge red day, we will see today, on Friday.
Volume does confirm price action as it is much bigger on drop day, however, it is still below 20 days average volume.
It is below 8 and 20 days MA but still above 50 and 200 days MA which will likely change today. 50 days mMA is DJIA's last support zone before it declared drop to the big red with almost certain.
RSI is neutral.
MACD ticking lower while the MACD line did cross below the signal line which is very bearish and signals a new trend is forming.
Overall: not too many things to say here. 50 days MA will be DJIA's last support line before major drops are triggered. It is less likely support will hold and it is likely we will test Bigred which should provide some support zone. From the bullish perspective only a close above 344 only the daily candles would be bullish and would we would be able to say now it is a confirmed bull market in DJIA. The possibility of that is only 10%.


DIA breakout guessDIA is in a coil (triangle pattern) after a big push up. After such great momentum upward, this looks like a good pennant pattern for a break up to eventually test the January 2022 highs. If you check the SPY it might also be in a flag pattern for a potential break up as well. Or it might be turning over. At any rate, I plan to wait for a break and plant stops accordingly in case of a head fake.

DJIA sell signal, short opportunity DJIA on daily we have been waiting for some time for a breakout of this triangle and yesterday it occur. At the beginning of the trading session, DJIA gapped up and retail traders tried to break it up but big boys enter that straight and start to sell, and the price drop right away and keep dropping until the end of the day. Now it is very likely DJIA will continue its move down but the question is how far away. Will 50 days MA hold as support today or will drop like a rock?
Volume though does not confirm price action as it was a pretty low volume on breakout which is not the best option for bears.
Still, the price is coiling between 8, 20, and 50 days MA which will move DJIA hard.
RSI is in a neutral position.
MACD histogram tick red and the MACD line cross below signal line signal shift in momentum and DJIA is going down.
Overall: maybe it is not all done for bulls. This low volume breakdown could mean it is only fakeout and death hook and DJIA will exploit to the upside. A drop below 50 days MA will be a 100% sign we are going down and down hard. The first major support would be the lower trend line and BigRed or 200 days MA. In that case, the huge bull flag would be formed, but the price needs to stay above the support lines.
From the other side, if bulls somehow buy in, step in like never before, and bring DJIA above the upper line, it would be a very very bullish move with targets towards ATH, but that is less likely.

weakness incomingDOW is the leading indicator to me. Dow weekly looks like it is about to wane. When I suspect it breaks down out of the wedge.

DJIA daily are we ready for a major move?DJIA daily is still in its symmetrical triangle and just can't move up or down from it. 8, 20, and 50 days MA are coiling on the same levels and will produce a major move in the one direction. Breakout or down should be strong and fast. It is very close to the end of the triangle but it seems it is more bearish than bullish. Just the fact it can't move away from the lower line is bearish.
Price is above r20, 50, and Big Red which is bullish, but if it drops, it will be right away below 20 and 50 days MA which will be bearish and fast.
Yesterday's volume confirms huge indecision in the market which can be both bearish and bullish.
RSI and MACD are for now neutral.
Overall: DJIA is probably the only indices that didn't receive a buy or sell signal in our Daily morning brief and will stay like that until it chooses which side will go. Break from the triangle will very likely be very powerful and strong. With the move up even testing of ATH would be possible, but with a move below trend lines support at Big Red will for sure be tested and then likely lows from 2022. Overall same like SPY, Powell's speech could move the market.

DIA Bullish pennant Dow Jones formed Golden Cross on DEc 14th now forming a bullish Pennant. Still above 200, 50 Day Moving Avg. If it breaks the pennant, we see more upside and may reach 2022 highs this year.
