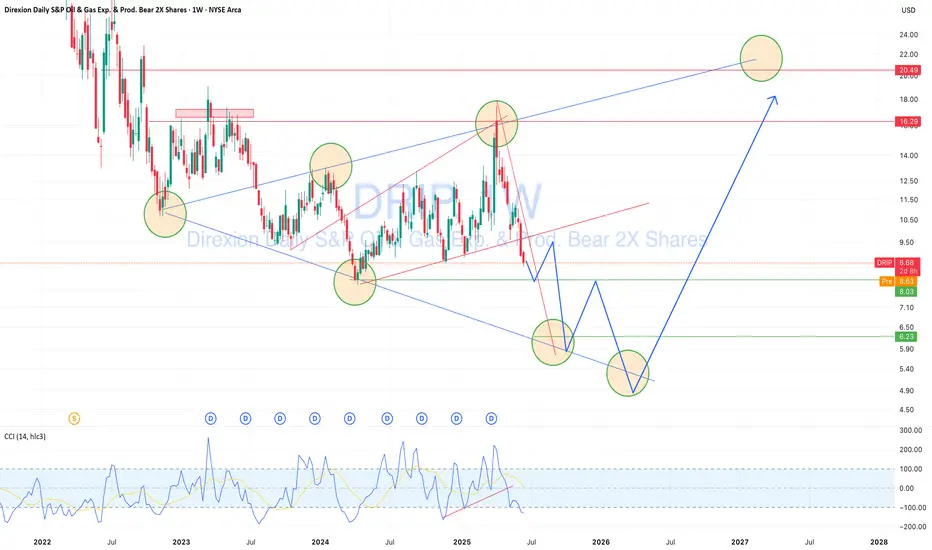
DRIP — Geopolitical Oil Risk Creates a Buying OpportunityDRIP (inverse 2x ETF on US oil & gas exploration/production) is approaching a key technical support zone.
While oil may continue rising short term due to geopolitical tensions — especially US-Iran risks and Middle East instability — this short-term pressure could push DRIP lower toward the $5.00–6.
Key stats
About Direxion Daily S&P Oil & Gas Exp. & Prod. Bear 2X Shares
Home page
Inception date
May 28, 2015
Structure
Open-Ended Fund
Replication method
Synthetic
Dividend treatment
Distributes
Distribution tax treatment
Ordinary income
Income tax type
Capital Gains
Max ST capital gains rate
39.60%
Max LT capital gains rate
20.00%
Primary advisor
Rafferty Asset Management LLC
Distributor
Foreside Fund Services LLC
DRIP seeks to deliver -200% of the daily performance of the S&P Oil & Gas Exploration & Production Select Industry Index. Unlike State Streets XOPan unlevered fund tracking the same indexDRIP uses over-the-counter derivatives to achieve its objective. As with all levered and inverse funds, DRIP should not be expected to deliver 2 times the performance of its index for periods longer than one day. Compounding and path-dependency can cause significant deviations over longer time frames, so it's best used for single-day tactical plays. It's worth noting that DRIP's index is equal weighted, market-cap weighting would require extreme concentration in a handful of major firms. As a result, DRIP exhibits a serious small-cap tilt and the elevated market risk that comes with it. DRIP's leverage factor only amplifies the potential for volatility. Trading costs should be taken into consideration. Prior to March 31, 2020, the fund provided -300% exposure to the same index.
Related funds
Classification
What's in the fund
Exposure type
Cash
Bonds, Cash & Other100.00%
Cash100.00%
Top 10 holdings
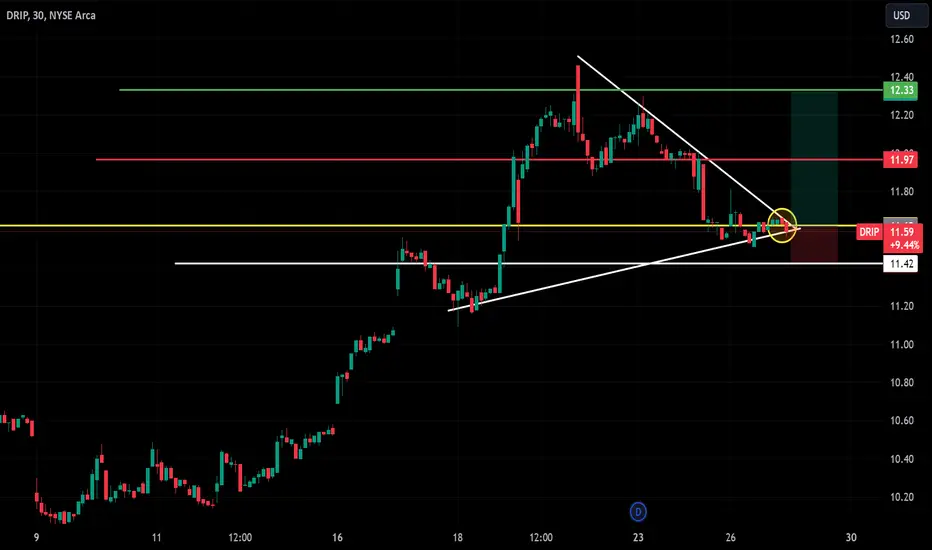
DRIP: Breakout Potential from Symmetrical Triange!DRIP is showing signs of a breakout from a symmetrical triangle pattern on the 30-minute chart.
Entry is set at the yellow line ($11.62) with the following trade parameters:
Stop Loss (SL): $11.42 (below lower trendline support).
Target 1 (T1): $11.97 (red resistance line).
Target 2 (T2): $12.33
Target $12.15 short, will waterfall if closes belowcurrently, my puts are active and im bullish on oil... Drip is showing a bearish head and shoulders and has rejected B leg of the bullish cypher 2x now.
See my oil Elliot Wave chart, in which I have a $95 target

$CVX $DRIP$DRIP and $CVX i have been watching and trading since last year also few other oil and energy companies! Im testing this years forecast i know it will drop but i am waiting for the earnings call. This will be a great catch!


heading to 12 soon, then 10 $xlebearish abc pattern from the 4th elliott wave. leading into a bearish abcd pattern. oil will take off again . long energy, natural gas stocks. I like xle

Trade Journal - DRIP, Feb 6 (long)Thesis
Crossed baseline recently, CLAMP is yellow (positive), correlation agrees.
Discovery
After entering a trade with BTB, I saw it correlated negatively to XOP, the oil and gas exploration etf. DRIP is a leveraged play on this symbol.
Correlation
+: BTB, XAGUSD, VIX
-: RUBUSD, XOP, UUUU
B

DRIP short oila deeper look at the chart on a lower time frame. hope it works out... globe is too broke to handle higher prices and not ready to break from SWIFT so the US wins for now i'm rooting for us

$DRIP oil majors will hold back new exploration and production. majors like BP turned on mega fields while prices to buy everything was cheap. they will pump their stocks now and hold back on new exploration and production and curtail current supply as required until 2024 to 2025

See all ideas
Summarizing what the indicators are suggesting.
Oscillators
Neutral
SellBuy
Strong sellStrong buy
Strong sellSellNeutralBuyStrong buy
Oscillators
Neutral
SellBuy
Strong sellStrong buy
Strong sellSellNeutralBuyStrong buy
Summary
Neutral
SellBuy
Strong sellStrong buy
Strong sellSellNeutralBuyStrong buy
Summary
Neutral
SellBuy
Strong sellStrong buy
Strong sellSellNeutralBuyStrong buy
Summary
Neutral
SellBuy
Strong sellStrong buy
Strong sellSellNeutralBuyStrong buy
Moving Averages
Neutral
SellBuy
Strong sellStrong buy
Strong sellSellNeutralBuyStrong buy
Moving Averages
Neutral
SellBuy
Strong sellStrong buy
Strong sellSellNeutralBuyStrong buy
Displays a symbol's price movements over previous years to identify recurring trends.
Frequently Asked Questions
An exchange-traded fund (ETF) is a collection of assets (stocks, bonds, commodities, etc.) that track an underlying index and can be bought on an exchange like individual stocks.
DRIP trades at 10.03 USD today, its price has risen 7.16% in the past 24 hours. Track more dynamics on DRIP price chart.
DRIP net asset value is 10.04 today — it's risen 4.42% over the past month. NAV represents the total value of the fund's assets less liabilities and serves as a gauge of the fund's performance.
DRIP assets under management is 46.94 M USD. AUM is an important metric as it reflects the fund's size and can serve as a gauge of how successful the fund is in attracting investors, which, in its turn, can influence decision-making.
DRIP price has risen by 6.25% over the last month, and its yearly performance shows a 5.80% increase. See more dynamics on DRIP price chart.
NAV returns, another gauge of an ETF dynamics, have risen by 4.42% over the last month, showed a −17.03% decrease in three-month performance and has increased by 7.85% in a year.
NAV returns, another gauge of an ETF dynamics, have risen by 4.42% over the last month, showed a −17.03% decrease in three-month performance and has increased by 7.85% in a year.
DRIP fund flows account for −11.60 M USD (1 year). Many traders use this metric to get insight into investors' sentiment and evaluate whether it's time to buy or sell the fund.
Since ETFs work like an individual stock, they can be bought and sold on exchanges (e.g. NASDAQ, NYSE, EURONEXT). As it happens with stocks, you need to select a brokerage to access trading. Explore our list of available brokers to find the one to help execute your strategies. Don't forget to do your research before getting to trading. Explore ETFs metrics in our ETF screener to find a reliable opportunity.
DRIP invests in cash. See more details in our Analysis section.
DRIP expense ratio is 1.04%. It's an important metric for helping traders understand the fund's operating costs relative to assets and how expensive it would be to hold the fund.
DRIP is an inverse fund, meaning it's structured to generate returns opposite to the trends of the underlying index or assets.
In some ways, ETFs are safe investments, but in a broader sense, they're not safer than any other asset, so it's crucial to analyze a fund before investing. But if your research gives a vague answer, you can always refer to technical analysis.
Today, DRIP technical analysis shows the buy rating and its 1-week rating is sell. Since market conditions are prone to changes, it's worth looking a bit further into the future — according to the 1-month rating DRIP shows the sell signal. See more of DRIP technicals for a more comprehensive analysis.
Today, DRIP technical analysis shows the buy rating and its 1-week rating is sell. Since market conditions are prone to changes, it's worth looking a bit further into the future — according to the 1-month rating DRIP shows the sell signal. See more of DRIP technicals for a more comprehensive analysis.
Yes, DRIP pays dividends to its holders with the dividend yield of 3.24%.
DRIP trades at a premium (0.10%).
Premium/discount to NAV expresses the difference between the ETF’s price and its NAV value. A positive percentage indicates a premium, meaning the ETF trades at a higher price than the calculated NAV. Conversely, a negative percentage indicates a discount, suggesting the ETF trades at a lower price than NAV.
Premium/discount to NAV expresses the difference between the ETF’s price and its NAV value. A positive percentage indicates a premium, meaning the ETF trades at a higher price than the calculated NAV. Conversely, a negative percentage indicates a discount, suggesting the ETF trades at a lower price than NAV.
DRIP shares are issued by Rafferty Asset Management LLC
DRIP follows the S&P Oil & Gas Exploration & Production Select Industry. ETFs usually track some benchmark seeking to replicate its performance and guide asset selection and objectives.
The fund started trading on May 28, 2015.
The fund's management style is passive, meaning it's aiming to replicate the performance of the underlying index by holding assets in the same proportions as the index. The goal is to match the index's returns.