DRV in Buy ZoneMy trading plan is very simple.
I buy or sell when at three of these events happen:
* Price tags the top or bottom of parallel channel zones
* Money flow spikes beyond it's Bollinger Bands
* Stochastic Momentum Index (SMI) at near oversold overbought level
* Price at Fibonacci levels
So...
Here's
Key stats
About Direxion Daily Real Estate Bear 3X Shares
Home page
Inception date
Jul 16, 2009
Structure
Open-Ended Fund
Replication method
Synthetic
Dividend treatment
Distributes
Distribution tax treatment
Ordinary income
Income tax type
Capital Gains
Max ST capital gains rate
39.60%
Max LT capital gains rate
20.00%
Primary advisor
Rafferty Asset Management LLC
Distributor
Foreside Fund Services LLC
DRV provides 3x inverse leverage exposure to the Real Estate Select Sector Index. DRV has exposure to the large-cap segment of the US Real Estate Sector as defined by GICS. The index applies certain caps to aid diversification rules imposed on RICs. The capping constraints of the index are: no group entity exceeds 25% of index weight, and no group entities with weight above 5% can exceed 50% of the index weight. Due to the fund's daily rebalancing, long-term returns are difficult to predict due to path dependency and compounding. As a result, DRV should be treated as a short-term trading vehicle as opposed to a long-term investment. Prior to February 28, 2022, the fund was named Direxion Daily MSCI Real Estate Bear 3X Shares, and tracked the MSCI US IMI Real Estate 25/50 Index.
Related funds
Classification
What's in the fund
Exposure type
Cash
Bonds, Cash & Other100.00%
Cash100.00%
Top 10 holdings

SOY 2024 - DRV Monthly Seasonality StatsThe chart for DRV (Direxion Daily Real Estate Bear 3X Shares) illustrates the significant volatility and performance trends from 2015 to 2024. DRV primarily shows negative returns in the first quarter, especially in January, with large declines in 2015, 2021, and 2022. February and March often sho

Inverse Real Estate DRVThe stage is set for another spike in this Inverse Real Estate ETF. 30-60% upside possible. Not trading advice.

DRV a triple leveraged Real Estate ETF LONGDRV as a ETF of real estate stocks is likely somewhat responsive to the financial environment.
My idea is that the recent rate hike of 0.25% will adversely effect home sales and liquidity
especially given that the Fed has indicated that there will be on easing this year but perhaps
some pauses.


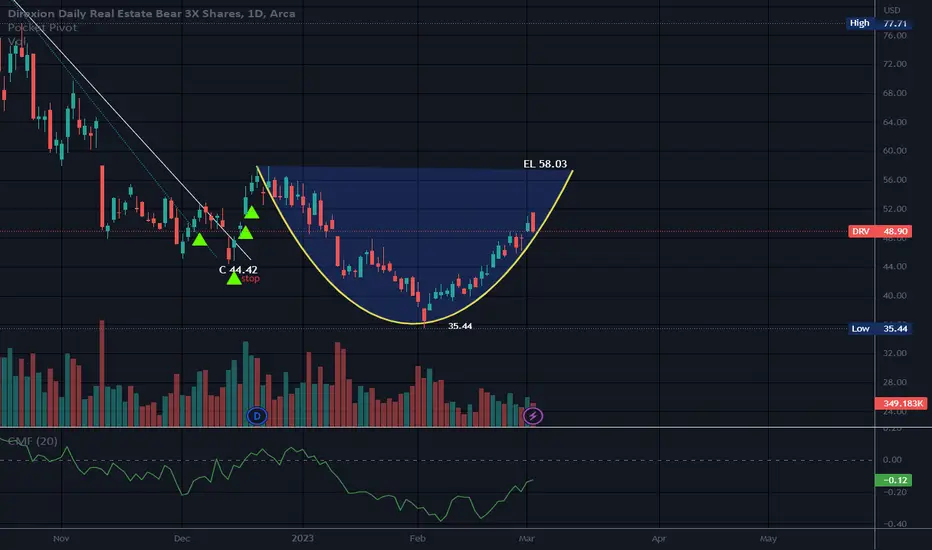
Cup and HandleThis is not to EL just yet.
This ETN is based on housing demise so if you feel housing is going up versus down, this would be a bad choice.
Leveraged.
No recommendation.
Direxion Shares ETF Trust - Direxion Daily Real Estate Bear 3X Shares is an exchange traded fund launched by Direxion Investmen

CuppingThere is no discernible handle.
Engulfing candle today.
I will revisit this.
No recommendation.
Direxion Shares ETF Trust - Direxion Daily Real Estate Bear 3X Shares is an exchange traded fund launched by Direxion Investments. The fund is managed by Rafferty Asset Management, LLC. The fund invest
Continuation Wedge (Bullish) | 48% move possibleDirexion Daily Real Estate Bear 3X Shares forms bullish "Continuation Wedge" chart pattern
"Continuation Wedge (Bullish)" chart pattern formed on Direxion Daily Real Estate Bear 3X Shares (DRV:NYSE). This bullish signal indicates that the stock price may rise from the close of $40.35 to the range


im forced to assume dumpsterfire in real estate still oncomparisons are telling us simply when more people are able to borrow money real estate does better. interest rate data from whale crew tells us as long as we climb this indication the risk gets worse for borrowers. as long as those go in the specified direction im looking at higher prices in this f

See all ideas
Summarizing what the indicators are suggesting.
Oscillators
Neutral
SellBuy
Strong sellStrong buy
Strong sellSellNeutralBuyStrong buy
Oscillators
Neutral
SellBuy
Strong sellStrong buy
Strong sellSellNeutralBuyStrong buy
Summary
Neutral
SellBuy
Strong sellStrong buy
Strong sellSellNeutralBuyStrong buy
Summary
Neutral
SellBuy
Strong sellStrong buy
Strong sellSellNeutralBuyStrong buy
Summary
Neutral
SellBuy
Strong sellStrong buy
Strong sellSellNeutralBuyStrong buy
Moving Averages
Neutral
SellBuy
Strong sellStrong buy
Strong sellSellNeutralBuyStrong buy
Moving Averages
Neutral
SellBuy
Strong sellStrong buy
Strong sellSellNeutralBuyStrong buy
Displays a symbol's price movements over previous years to identify recurring trends.
Frequently Asked Questions
An exchange-traded fund (ETF) is a collection of assets (stocks, bonds, commodities, etc.) that track an underlying index and can be bought on an exchange like individual stocks.
DRV trades at 24.03 USD today, its price has risen 2.04% in the past 24 hours. Track more dynamics on DRV price chart.
DRV net asset value is 23.12 today — it's fallen 8.37% over the past month. NAV represents the total value of the fund's assets less liabilities and serves as a gauge of the fund's performance.
DRV assets under management is 44.66 M USD. AUM is an important metric as it reflects the fund's size and can serve as a gauge of how successful the fund is in attracting investors, which, in its turn, can influence decision-making.
DRV price has fallen by −8.32% over the last month, and its yearly performance shows a −20.25% decrease. See more dynamics on DRV price chart.
NAV returns, another gauge of an ETF dynamics, have fallen by −8.37% over the last month, showed a −12.80% decrease in three-month performance and has decreased by −23.31% in a year.
NAV returns, another gauge of an ETF dynamics, have fallen by −8.37% over the last month, showed a −12.80% decrease in three-month performance and has decreased by −23.31% in a year.
DRV fund flows account for −16.86 M USD (1 year). Many traders use this metric to get insight into investors' sentiment and evaluate whether it's time to buy or sell the fund.
Since ETFs work like an individual stock, they can be bought and sold on exchanges (e.g. NASDAQ, NYSE, EURONEXT). As it happens with stocks, you need to select a brokerage to access trading. Explore our list of available brokers to find the one to help execute your strategies. Don't forget to do your research before getting to trading. Explore ETFs metrics in our ETF screener to find a reliable opportunity.
DRV invests in cash. See more details in our Analysis section.
DRV expense ratio is 1.06%. It's an important metric for helping traders understand the fund's operating costs relative to assets and how expensive it would be to hold the fund.
DRV is an inverse fund, meaning it's structured to generate returns opposite to the trends of the underlying index or assets.
In some ways, ETFs are safe investments, but in a broader sense, they're not safer than any other asset, so it's crucial to analyze a fund before investing. But if your research gives a vague answer, you can always refer to technical analysis.
Today, DRV technical analysis shows the sell rating and its 1-week rating is sell. Since market conditions are prone to changes, it's worth looking a bit further into the future — according to the 1-month rating DRV shows the sell signal. See more of DRV technicals for a more comprehensive analysis.
Today, DRV technical analysis shows the sell rating and its 1-week rating is sell. Since market conditions are prone to changes, it's worth looking a bit further into the future — according to the 1-month rating DRV shows the sell signal. See more of DRV technicals for a more comprehensive analysis.
Yes, DRV pays dividends to its holders with the dividend yield of 4.52%.
DRV trades at a premium (0.51%).
Premium/discount to NAV expresses the difference between the ETF’s price and its NAV value. A positive percentage indicates a premium, meaning the ETF trades at a higher price than the calculated NAV. Conversely, a negative percentage indicates a discount, suggesting the ETF trades at a lower price than NAV.
Premium/discount to NAV expresses the difference between the ETF’s price and its NAV value. A positive percentage indicates a premium, meaning the ETF trades at a higher price than the calculated NAV. Conversely, a negative percentage indicates a discount, suggesting the ETF trades at a lower price than NAV.
DRV shares are issued by Rafferty Asset Management LLC
DRV follows the S&P Real Estate Select Sector. ETFs usually track some benchmark seeking to replicate its performance and guide asset selection and objectives.
The fund started trading on Jul 16, 2009.
The fund's management style is passive, meaning it's aiming to replicate the performance of the underlying index by holding assets in the same proportions as the index. The goal is to match the index's returns.