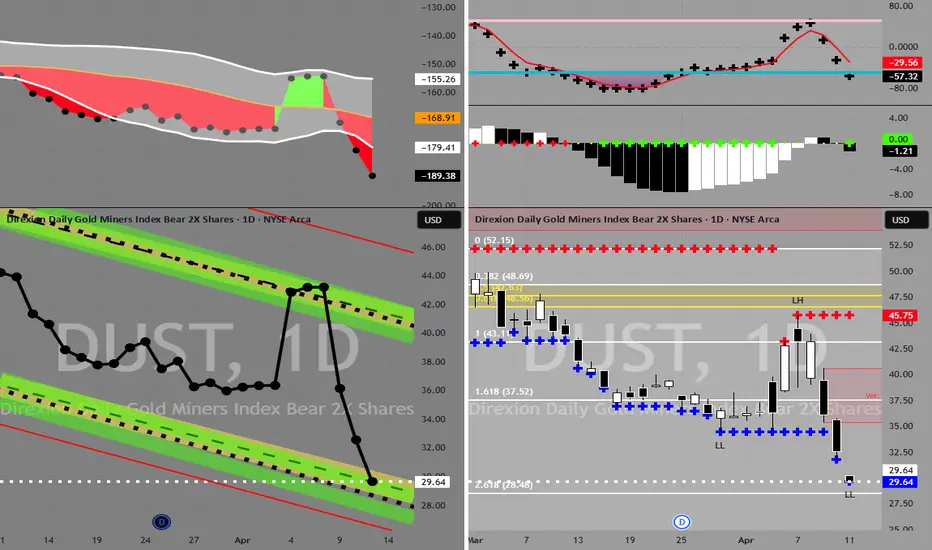
DUST in Buy ZoneMy trading plan is very simple.
I buy or sell when at three of these events happen:
* Price tags the top or bottom of parallel channel zones
* Money flow spikes beyond it's Bollinger Bands
* Stochastic Momentum Index (SMI) at near oversold overbought level
* Price at Fibonacci levels
So...
Here's
Key stats
About Direxion Daily Gold Miners Index Bear 2X Shares
Home page
Inception date
Dec 8, 2010
Structure
Open-Ended Fund
Replication method
Synthetic
Dividend treatment
Distributes
Distribution tax treatment
Ordinary income
Income tax type
Capital Gains
Max ST capital gains rate
39.60%
Max LT capital gains rate
20.00%
Primary advisor
Rafferty Asset Management LLC
Distributor
Foreside Fund Services LLC
DUST is an aggressive inverse play on the widely followed gold mining index, the NYSE Arca Gold Miners Index. The fund promises to provide inverse exposure to these firms with a leverage factor of 2 on a daily basis. Like most leveraged and inverse products, it's designed to provide a one-day bet on the index. As such, the fund is designed to be held for no more than one trading day. For longer periods, the effects of compounding may cause it to sometimes drift from the -200% exposure it promises to provide to the underlying index. Since the fund is designed for daily use, the trading costs are of greater importance. Prior to March 31, 2020, the fund provided 3x inverse daily exposure to the same index.
Related funds
Classification
What's in the fund
Exposure type
Cash
Bonds, Cash & Other100.00%
Cash100.00%
Top 10 holdings
DUST to $54My trading plan is very simple.
I buy or sell when price tags the top or bottom of parallel channels.
I confirm when price hits Fibonacci levels.
So...
Here's why I'm picking this symbol to do the thing.
Price at bottom channels (period 100 52 & 26)
Stochastic Momentum Index (SMI) at oversold

38.2% marks the local top?Has AMEX:DUST reached the psychological limit for the bears sticking their neck out there to short miners?

2XBEAR MINERS LOOKING GOOD FROM HERE!It's time for precious metals to take a cooler.
I noticed JDST's options for $5 is off the chart compared to other months. I bought calls for .20 for $5 strike price in September. I anticipating these going to 2.00 by then which is 1000% return.
I also think DUST is worthy of buying at these levels

Multiple bear flags present target 7.70 necklineAMEX:DUST Gold 3x bear etf has multiple bear flags present on this chart, there's a smaller bear flag/rounding top inside the larger bear flag. In fact, there's an apex of the triangle present as well. 1hr/2hr are overbought. In addition, AMEX:DUST has failed to take out the premarket high from

DUST Stock Chart Fibonacci Analysis 021724Trading Idea
1) Find a FIBO slingshot
2) Check FIBO 61.80% level
3) Entry Point > 14.2/61.80%
Chart time frame : B
A) 15 min(1W-3M)
B) 1 hr(3M-6M)
C) 4 hr(6M-1year)
D) 1 day(1-3years)
Stock progress : B
A) Keep rising over 61.80% resistance
B) 61.80% resistance
C) Hit the bottom
D) Hit the top


Are miners about to crash? Looks like it to meDust looks like it's putting in a bottom to me. Also, there's a big falling wedge forming.
If we see a breakout of this pattern (which I think will materialize over the next week or so), I think we'll see a sharp move higher in $DUST and miners should fall quickly.
I'd be targeting the $17 resist

DUST Stock Chart Fibonacci Analysis 032223
1) Find a FIBO slingshot
2) Check FIBO 61.80% level
3) Entry Point > 11.6/61.80%

Buy Dust to Short gold opportunity soon?If you belive gold will correct and the dollar will go up first half of 2023.
Buying dust might be a opportunity. The setup and cyles looks nice.
I am waiting for volume and a swing low with short term avrages
and oscilators confirming the move. Also the dollar must show strength.
Last COT data mus

See all ideas
Summarizing what the indicators are suggesting.
Oscillators
Neutral
SellBuy
Strong sellStrong buy
Strong sellSellNeutralBuyStrong buy
Oscillators
Neutral
SellBuy
Strong sellStrong buy
Strong sellSellNeutralBuyStrong buy
Summary
Neutral
SellBuy
Strong sellStrong buy
Strong sellSellNeutralBuyStrong buy
Summary
Neutral
SellBuy
Strong sellStrong buy
Strong sellSellNeutralBuyStrong buy
Summary
Neutral
SellBuy
Strong sellStrong buy
Strong sellSellNeutralBuyStrong buy
Moving Averages
Neutral
SellBuy
Strong sellStrong buy
Strong sellSellNeutralBuyStrong buy
Moving Averages
Neutral
SellBuy
Strong sellStrong buy
Strong sellSellNeutralBuyStrong buy
Displays a symbol's price movements over previous years to identify recurring trends.
Frequently Asked Questions
An exchange-traded fund (ETF) is a collection of assets (stocks, bonds, commodities, etc.) that track an underlying index and can be bought on an exchange like individual stocks.
DUST trades at 22.84 USD today, its price has risen 1.79% in the past 24 hours. Track more dynamics on DUST price chart.
DUST net asset value is 22.78 today — it's fallen 5.99% over the past month. NAV represents the total value of the fund's assets less liabilities and serves as a gauge of the fund's performance.
DUST assets under management is 117.53 M USD. AUM is an important metric as it reflects the fund's size and can serve as a gauge of how successful the fund is in attracting investors, which, in its turn, can influence decision-making.
DUST price has fallen by −7.73% over the last month, and its yearly performance shows a −65.60% decrease. See more dynamics on DUST price chart.
NAV returns, another gauge of an ETF dynamics, have fallen by −5.99% over the last month, showed a −23.86% decrease in three-month performance and has decreased by −62.82% in a year.
NAV returns, another gauge of an ETF dynamics, have fallen by −5.99% over the last month, showed a −23.86% decrease in three-month performance and has decreased by −62.82% in a year.
DUST fund flows account for 90.97 M USD (1 year). Many traders use this metric to get insight into investors' sentiment and evaluate whether it's time to buy or sell the fund.
Since ETFs work like an individual stock, they can be bought and sold on exchanges (e.g. NASDAQ, NYSE, EURONEXT). As it happens with stocks, you need to select a brokerage to access trading. Explore our list of available brokers to find the one to help execute your strategies. Don't forget to do your research before getting to trading. Explore ETFs metrics in our ETF screener to find a reliable opportunity.
DUST invests in cash. See more details in our Analysis section.
DUST expense ratio is 0.93%. It's an important metric for helping traders understand the fund's operating costs relative to assets and how expensive it would be to hold the fund.
DUST is an inverse fund, meaning it's structured to generate returns opposite to the trends of the underlying index or assets.
In some ways, ETFs are safe investments, but in a broader sense, they're not safer than any other asset, so it's crucial to analyze a fund before investing. But if your research gives a vague answer, you can always refer to technical analysis.
Today, DUST technical analysis shows the sell rating and its 1-week rating is strong sell. Since market conditions are prone to changes, it's worth looking a bit further into the future — according to the 1-month rating DUST shows the sell signal. See more of DUST technicals for a more comprehensive analysis.
Today, DUST technical analysis shows the sell rating and its 1-week rating is strong sell. Since market conditions are prone to changes, it's worth looking a bit further into the future — according to the 1-month rating DUST shows the sell signal. See more of DUST technicals for a more comprehensive analysis.
Yes, DUST pays dividends to its holders with the dividend yield of 1.68%.
DUST trades at a premium (0.28%).
Premium/discount to NAV expresses the difference between the ETF’s price and its NAV value. A positive percentage indicates a premium, meaning the ETF trades at a higher price than the calculated NAV. Conversely, a negative percentage indicates a discount, suggesting the ETF trades at a lower price than NAV.
Premium/discount to NAV expresses the difference between the ETF’s price and its NAV value. A positive percentage indicates a premium, meaning the ETF trades at a higher price than the calculated NAV. Conversely, a negative percentage indicates a discount, suggesting the ETF trades at a lower price than NAV.
DUST shares are issued by Rafferty Asset Management LLC
DUST follows the NYSE Arca Gold Miners. ETFs usually track some benchmark seeking to replicate its performance and guide asset selection and objectives.
The fund started trading on Dec 8, 2010.
The fund's management style is passive, meaning it's aiming to replicate the performance of the underlying index by holding assets in the same proportions as the index. The goal is to match the index's returns.