EEM trade ideas

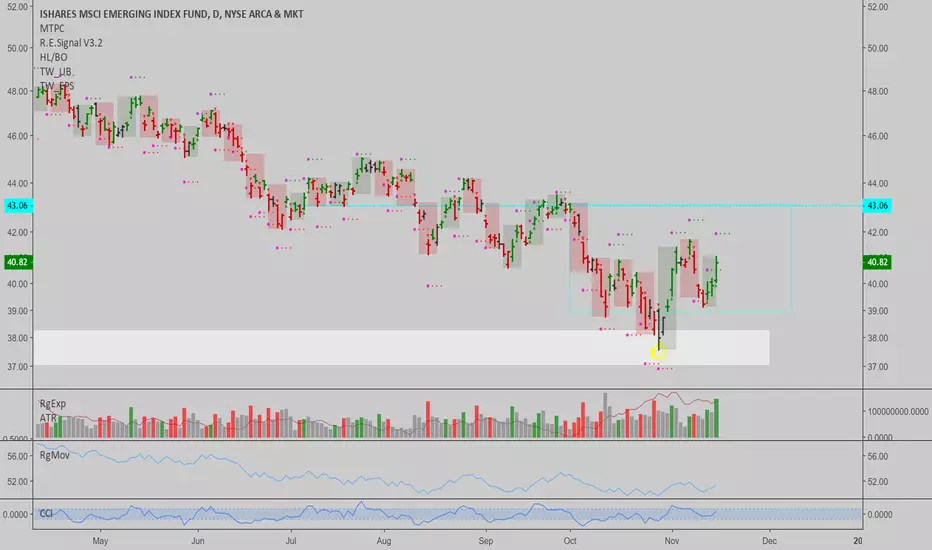
EEM: Daily buy signal$EEM has now flashed a buy signal, together with $SPY, and offers a great chance to go long with low risk. Emerging markets might benefit from the rally in oil which I foresee here.
Good luck,
Ivan Labrie.
EEM trendlineI'm not so sure that 37 is the target... I can see it going to 33 if the rest of the market continue showing weakness.

EEM - RSI In Oversold Territory?On support
Wedge height is massive, the price target is long-term 70 up to 80


EEM. Emerging Index Fund. Possible map of WXYThis is how I see the map for EEM.
It contradicts with the news background as EM countries are under pressure now.
But this is how I see the wave count now.
The wave 5 to the upside is pending and we could see some relief for EM...temporarily.
Invalidation for this count is below the 38.32 when the wave 1 will be broken

Textbook bearish trend, it's still a sell- Impressive rally back to important bearish key support zone, but...
- I still see lower highs and lower lows. Until this changes (a higher low print needed), it is a classic bearish trend.
- Ichimoku setup is still bearish, EWO and MACD also in bearish territory.

EEM: retesting uptrend mode supportThis is a major signal in emerging markets, prices have slumped and returned to the last big accumulation level from where the bull market started recently. This is a major buy opportunity, and possibly also linked to a major bottom in global equities and oil.
Best of luck,
Ivan Labrie.

EEM (The moment of truth)EEM the emerging market index ETF. there are two possible routes at this point. It is the moment of truth for this sector. Monthly breakout now retesting the break out TL. If it breaks below the trendline this month, it will go straight down, auch, brutal. However, I see this is low possibility, because I can see SPY bouncing (see my other post). So I would expect EEM take a break and go higher from here (just pray dollar dont go to the roof). After a bounce, we may well go straight down as we are in the 9th inning of the cycle.

EEM vs PA and AutosEEM vs PA and Autos
Palladium follows EMs and Autos.
Palladium has diverged due to tight supply?

EEM: Price target of 53.3 to 60.2 (long-term)Dear all, the long-term charts and a forward looking ~year long time frame (markets are relatively timeless/ respect support and resistance levels more than anything) are looking very interesting. From the plain Fibonacci spread which spans Wave 3 (late Dec. 16 to late Jan. 17) and the two orange arrows we see that wave 4 has retraced almost exactly 50% of wave 3. Per expectations there is a 70% chance it retraces to within 38.2 - 61.8% of Wave 3 so we are directly in the middle of the highest probability scenario- textbook price action.
The question right now is whether we have bottomed short-term and obviously this is impossible to know but from the orange arrow in the MACD rectangle we can see bullish convergence so it is entirely plausible that we have but obviously this is still an assumption and we could see further downside with the 61.8 support of 40.82 being the next line of support. From the rainbow colored Fibonacci trend (Waves 2-4) derived levels I have a long-term target for completion of the fifth-wave of between the 0.618 - 1 levels which correspond to 53.3 to 60.2 per the title of this article.
Thanks for reading, please feel free to ask any questions, leave a comment, or debate me if you disagree.
Disclaimer: While I am a firm believer that markets are driven by alternating waves of optimism and pessimism or put short investor sentiment there are exceptions to every rule. The link between strength of the dollar and the performance of foreign currency based investments; by definition, is a serious factor that must be considered. Thus if you think the dollar is going to weaken EEM, VWO, and any investment vehicle denominated in foreign currencies should be a screaming buy and vice-versa.

Risky BUY: EEM (Emerging Markets) on touch of parallel channel Risky BUY EEM upon touch of lower boundary of parallel channel. Stop loss at today's minimum and target at last gap down. Attractive loss to gain ratio.

Emerging Markets is coming back into long term supportEmerging markets ETF is coming back to a solid support area. Buyers should have a low risk high reward entry spot down here.

OPENING: EEM NOV/JAN 36/40/40/44 DOUBLE DIAGONAL... for a 1.38/contract credit.
Metrics:
Rank/Implied: 68/29
Max Profit on Setup: 1.38/contract
Max Loss/Buying Power Effect on Setup: 2.62/contract
Delta: -9.51
Theta: 2.06
Notes: I've done a few of these before. The way I look at them is that they offer the flexibility of a naked, while keeping your risk defined. An additional small benefit is that you don't have to leg in and out of the longs if you want to reuse them, saving a smidge in fees, assuming that you don't have to adjust the long strangle aspect too much to keep your risk where you want it. Will look to take profit on the short straddle at 25% and then reuse the long strangle ... .

EEM - bullish count emerging markets?Not putting that much faith in this count as it's difficult to ignore all the doom and gloom surrounding emerging markets at the moment (or is that bullish?) but with the yearly pivot in play and a bounce dead on the 70.7 fib retracement you never know.....

Emerging markets bounce? Emerging Markets ETFs are in a parallel channel. Price just bounced on the lower limit.
Investors are concerned about the high inflation to be expected in the US (3.7% unemployment = wages going up) which would encourage the FED to raise interests even more and drive the USD up. A high USD and higher yields would draw investors away from EM because they could get a decent return at lower risk (Bonds or T-Bills). The trade war risks is obviously not helping. In addition, higher interest rates would result in higher DEBT/GDP ratios in emerging countries that
However, one can argue that those factors have been priced in since EEM is down 25% in 2018, and it could be a good time to buy.
I would not be too confident about that. If the overall trend goes down, EM are likely to perform poorly.
If Trump backs-up on tariffs, which is extremely unlikely, then the outlook could change.
Trade safe!

Long term buy EEM on pullback to broken downward trend lineLong term buy EEM on pullback to broken downward trend line. Wave 3 imminent.


EEM As Leading Indicator For Bitcoin TradesEEM correlation obvious by now
The worst is in. More downside possible but 2019 should see major rally looking at RSI readings
