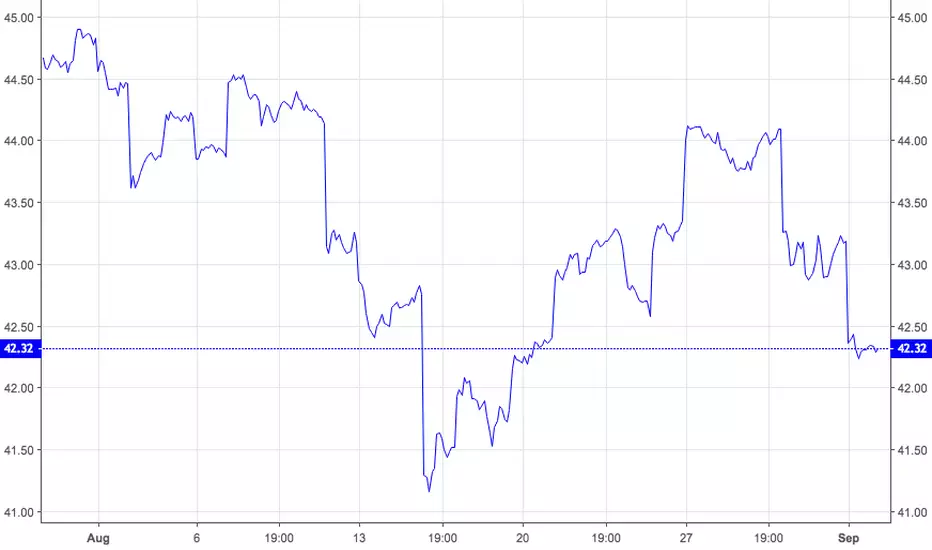
Emerging Markets Very Cllear Elliott Wave PatternThe Emerging Markets (EEM) has a very clear Elliott wave pattern that could be an aid into timing of a significant global stock market top.
March to May 2018 had a considerable amount of chop. It now appears that Minute wave "i" - boxed was an Elliott wave Leading Diagonal Triangle (LDT).
And it appears that Minuette wave ( i ) of Minute wave i - boxed was also an LDT. Fascinating!
**** Important note, the motive waves 1, 3, and 5 of an LDT sub divide into five waves patterns. This is different from Elliott wave Ending Diagonal Triangles in which motive waves 1, 3, and 5 sub divide into three wave patterns.
Target zone for the presumed Minor wave "2" up is in the area of 45.00 this could be reached in one or two weeks, corresponding with important SPX and UKX tops. More on this latter if necessary.
Mark
EEM trade ideas


Emerging markets is extremely bearishBearish shooting star pattern right into channel resistance and just below major resistance line. You'd have to off your rocker to buy EEM exposure here, not with Fed day next week.

MSCI emerging markets Similar past, veryYou do not have to be a genius to see the huge similitures of the past charts of the emerging markets msci of exactly 10 years ago¡ , specifically in 2008, where you can clearly see an upturn in investment in these markets msci very, very strong up, reaching a summit to explosion and crach donw , it can practically be seen as a carbon copy 10 years later the same pattern almost yes,
well You may not remember it , but exactly 10 years ago it was the resection in North America.
Well coincidences, possibly.
but without a doubt the Charts are very similar to those of the past.

At long last, a potential bottom in EEMAfter much heartbreak, there seems to be a potential bottom in EEM -- we need to see a corrective move back down for a (2), and then we are off to the races!


Is bitcoin an emerging market currency?BTC mimics MSCI Emerging Markets Curr Index / US Dollar Index.
The similarity is visible! Bitcoin price is the green line.
Thanks to my friend @EnginSavas for this idea


Sell Break of 41.30 Emerging Markets EEMSell Break of 41.30 Emerging Markets ETF EEM
Rally Top Has been Built in the Emerging Markets ETF in August
with Gaps to the Upside to Trap the Bulls, Now in Place.
Argentina Currency Crisis is only the latest trigger point,
renewing a potential downward spiral, taking place across the globe.
THE_UNWIND


EEM -- do we see a proper EM bear?At present, it does indeed look like we are not making a sustainable move up. I see 2 pretty scary fractals potentially playing out.
Firstly, as can be seen here - a hourly fractal of 29th May 2018 - playing out on the daily. Which portends a move up to around the 46.x mark, before we head meaningfully lower.
Secondly, as can be seen here: - this is a daily fractal my system has isolated as what might be playing out here.
Before you dismiss this as bear fodder, please consider the fact that when you, in your mind's eye, compress the entire 2008 - 2009 fractal, into an hourly, you can begin to see how the fractal could be fathomed as the hourly fractal from the 29th May, which seems to be echoing again through history up until the present moment.
Where am I wrong
1. For now, I am not short. In fact I am long
2. When we get the blue bars, I will begin to initiate long dated hedges to my longs
3. If we bust through the 46.x mark, then I will fall back to the 2nd best fractal match
Comments provided in the chart itself

Emerging Markets: a Bull Flag on EEM?There looks to be a Bull Flag setting up on the weekly chart of the Emerging markets ETF, EEM.
The Flag pole for this Flag is about $20 in length and technical theory would suggest that this could be the extent of the upside move on any bullish breakout.
Thus, watch the weekly chart's Flag trend lines for any breakout.

The Dollar is King This chart shows a relationship that every trader who is serious with the business has to keep in mind. The dollar is king, A STRONG DOLLAR ends up WEAKENING
EMERGING MARKETS . This causes a capital flow away from them into safer dollar assets.
Right now , my game plan for the foreseeable future is to look for a short with good risk reward in the EEM as a whole , or break it down into its constituents and look for specific shorts in its holdings.
This dollar strength will also affect commodities , Stocks tied to commodities , XLE , and a myriad of other assets
Exciting times.

A sign that Emerging Markets (EEM) have bottomedThe EEM ETF is showing some signs that the worst is behind us. Firstly, the market has made a double-bottom, first fall on the 22nd June, and then the second last week on the 15th August. Double-bottoms flush out the weaker hands, who tried to pick the bottom in June. Empirically markets are more likely to rally following the second capitulation.
Secondly, the price is showing a divergence from its indicators below. The indicators showing 'higher-low', while price shows 'lower-low'. The key is to trade using the indicator, and this divergence of the two is bullish. Thirdly, the ETF bottomed last Wednesday the 15th, with the day forming a Doji candle. This candle means the market opened and closed near the same price, a sign that the selling frenzy is over and the market is reversing. Doji candles often mark reversals.

EEM Hits Lower Trend LineThe EEM has bounced off its lower trend line with a daily RSI bullish divergence and bullish Stochastic cross over.
It looks like EEM could rally for about two weeks which may coincide with a move up for the DJI and SPX.
Mark

EEM Bearish Trend Continues-> Buy PUTS OptionsHey guys,
These last few weeks, I've been enjoying passive investing with TQQQ and UPRO, but today I took my profits and found a great opportunity in betting that emerging markets will go down. I bought the 47.5 puts and 49 puts today. EEM has recently had a "small bounce" up and then it got smacked down hard today. With a break of the lows,(Coming Soon) EEM should go atleast to 41.00 and most likely 40.00. My puts expire in December and this trade has an expectancy of 50% Profits when the stock goes to 40.00 per share. To me, this like a very probably trade. Let me know what you think.
Thanks.


EEM - Emerging MarketsEM are big right now, so is the IV behind them.
Sold -1 Oct19 $43 put for $1.32
Risk: 2x cr received or possibly continue to roll out if the allocation deems worth it.
Profit: 50% cr received or roll up as EM recover. EEM has proven to shrink back down to low IV quickly, so that might not be the best play.

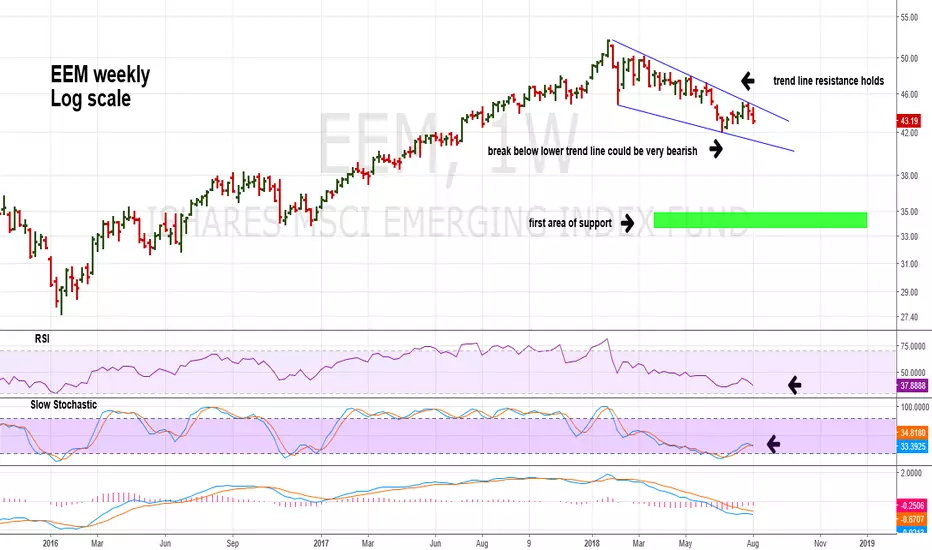
Emerging Markets Could be Leading the Way DownFellow Trading View member "The Unwind" has a terrific post about a 3 times short Emerging Market ETF.
The Unwind could be on to something big. The weekly Emerging market ETF - EEM has just finished a bounce and appears to have started a new down wave.
Weekly Stochastic just had a bearish cross over and the weekly RSI is still not in the over sold zone.
The Emerging markets which tracked the SPX from 2016 to early 2018 is now significantly under performing both the US stock market and most other large national stock markets.
In the next few weeks SPX may start joining EEM to the downside.
Mark

EEM- Similar to 2008 S&P500 setup Everyone EEM chart setup looking like S&P500 chart , Waiting for retest of highs.
