Emerging market sell off followed by market bottom and rebound?Emerging markets have been getting hammered since the 2008 crash. US markets and some European markets have already blasted past their previous highs as the economy has comeback. In the near term emerging markets seem to be capitulating on fear of growth and currency concerns. A closer look and one sees that the majority of this risk has already been priced in, and that the GDPs of many of these countries have increased substantially amounts since their market tops in 2007-2008. Growth concerns are almost unwarranted as all of these economies will most likely continue to outperform OECD countries in growth.
In other words, I expect waterfall type sell-off to occur were all the towels are thrown in and emerging markets become substantially cheap. Various currencies this year have been substantially devalued against the dollar, and once it all settles down, emerging markets will have outsize- long-term promise.
late feb to mid april seem like to prime candidates for when to buy emerging markets
Update: Support held for now on the channel and a double bottom might developing. I think this time the upside WILL break the upper resistance. Emerging markets are ready to play catch up. Brazil/Turkey my favorite for BIG BIG cheese. Indonesia and Vietnam looking good too, more charts to come.
EEM trade ideas


Buy the EEM versus a short in the SPY for 2014There are times when one gets ahead of the other but it hasn't stayed that way forever. As the year-end is upon us, perhaps there is more potential in the next 12 months to be long the EEM (Emerging Markets) instead of the S&P500.
Risk 10%, Goal 10%. Probability 75% (my impression) of profit.
Would anyone like to comment on the valuation disparity between these ETF's and make a fundamental analysis? Or, feel free to wait for my analysis.
Monday, December 16, 2013 10:28AM EST


Moderate buy using double top pattern.i would wait for a double bottom buy signal then buy and play it short term.


EEM - wait and seeAfter a breakout should EEM be able to stay above 43 for one or two days. If I recognize this I consider about going long. In case of a breakdown I don't like to go short, but it would be a very bearish picture.

Emerging TrapFound this one when i was looking to the emerging markets scenario. The perfection on the ratios is pretty impressive. The AC goes beyond the 0.618, however the ABC is the only part where we can apply some kind of discretionary criteria.
So i conclude that we might have an emerging trap in front of us.


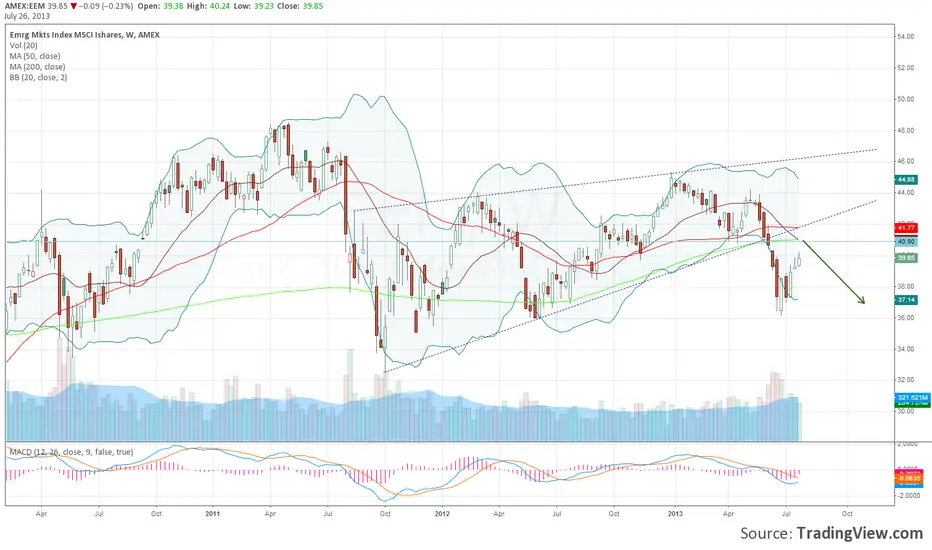
40.90 will stop EEM40.90 will stop EEM to resume the correction and goes down to 36- 32 soon 2-3 months , this resistance supported by by re-testing the wedge and 200-20-50 SMA
Ben Bernanke Speaks and Emerging Markets Taking a HitSince the crash of 2008 emerging markets have seen enormous amounts of capital inflows. As you can see with volume on this chart money has poored into a very popular Emerging Market ETF, EEM. If you look closely, after significant corrections emerging markets are leading US markets. So look for EEM to push out of this recent correction at a higher rate of return compared to the S&P, DJIA and Nasdaq.
What the chart is telling us with this volume and Fibonacci study, emerging markets have capitulated in the near term. On balance volume OBV is near the 2011 US market/Emerging market bottom. Chaiken Money Flow as well as the Elder Force Index, both volume indicators, are suggesting capitulation as well. If I were to use CMF and EFI, I would wait to see both cross the 0 median line before getting bullish.
Another new indicator is the volume weighted-adjusted moving average VWMA. The Volume Weighted Moving Average is a weighted moving average that uses the volume as the weighting factor, so that higher volume days have more weight. It is a non-cumulative moving average, in that only data within the time period is used in the calculation. When the VWMA is distant from the actual price, it suggest capitulation. On weekly the VWMA is at 42.07 while price barely stands on a recent fib line at 38.61.
Looking at price action we can see we have made higher highs and lower lows since the 2011 drop. With the larger fib line (shown on the thumbnail image, not here} we might want to look at is the .382 retrace at 37.90 for support and 37.21 for further support/possible weekly tweezer bottom in the near term.


Long SPY, Short EEM PAIRS TRADEIt looks to me that the S&P500 is leading the Emerging Markets Index, setting up a disparity that could be resolved in any number of ways:
1. The S&P could rally and the EEM could rally less.
2. The S&P could continue to fall, and the EEM could fall more.
3. The S&P could stabilize, and the EEM could slide lower.
The risk isn't very high in this pair, but keep the risk to 3% and the upside is approximately 5%. You can see that they are 3.6% apart in performance since June (EEM +8.48% - SPY +4.81% = 8.4-4.8 = 3.6)
