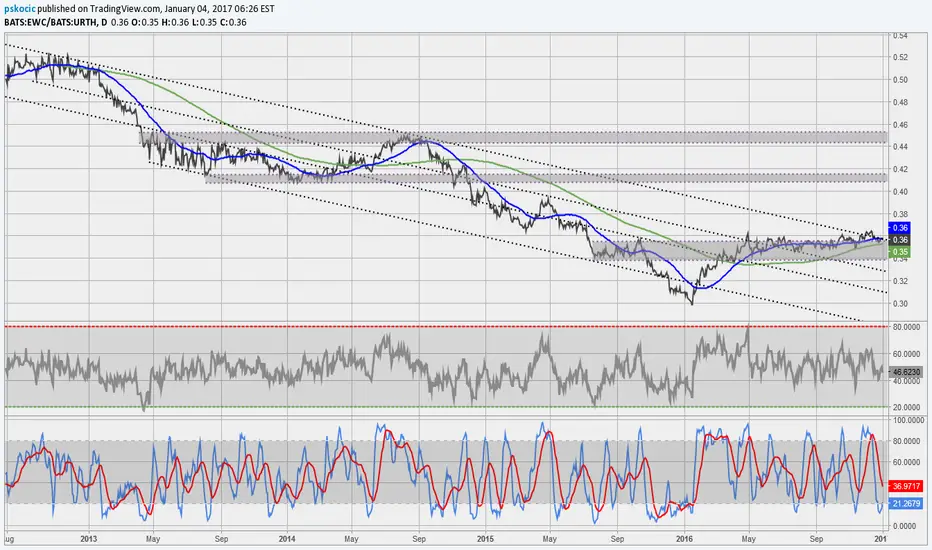
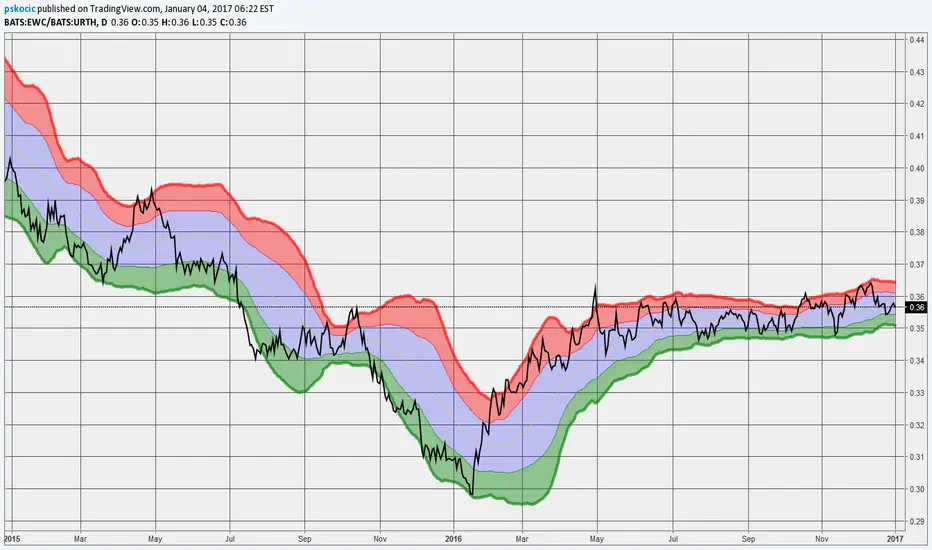
**** Long Canada Short US Oil Gas ETF ***Intra-sector Energy Trade here
Canada Index Trading on a low relative to XLE US Energy Oil and Gas.
There is a strong Reversal potential here
Key stats
About iShares MSCI Canada Index Fund
Home page
Inception date
Mar 12, 1996
Structure
Open-Ended Fund
Replication method
Physical
Dividend treatment
Distributes
Distribution tax treatment
Qualified dividends
Income tax type
Capital Gains
Max ST capital gains rate
39.60%
Max LT capital gains rate
20.00%
Primary advisor
BlackRock Fund Advisors
Distributor
BlackRock Investments LLC
EWC aims to capture the large- and mid-cap segments of the Canadian market while reflecting capping constraints. Its underlying index is market cap-weighted and rebalanced on a quarterly basis using a variation of the MSCI 25/50 Indexes methodology, where the weight of any single group entity will be constrained at 22.5% and the sum of the weights of all group entities representing more than 5% weight will be constrained at 24.5%. By doing so, it minimizes index turnover, tracking err and extreme deviation from the parent index. Moreover, a buffer is used to reduce the risk of non-compliance due to short term market movements between two quarterly rebalancing. Prior to September 2017, the funds underlying index was the MSCI Canada Index (where the MSCI Canada Custom Capped Index is constructed from).
Related funds
Classification
What's in the fund
Exposure type
Finance
Non-Energy Minerals
Stock breakdown by region
Top 10 holdings

EWC - 6.17% Profit Potential Swing Trade Setup - PennantBullish Pennant formed after a steady bull run.
I have not identified a clear technical target, however, I love the risk/reward ratio on this trade and I still feel this is an opportunity to pursue.
- Target Entry: $36.83
- Target Stop Loss: $36.50
- Target Exit: $39.00
- Risk / Reward Ratio: 6.58

Short EWC. Time symmetry and fib retracement levelsEither a clean break at time symmerty at the fib level, or a false move up first. Or, the short setup fails and the short-term bullish trend continues

SHORT Canadian index EWCEWC is based mainly on financial sector and banking depends on house debt.
Real estate market in Canada didn't suffer as US RE so the potential is reall big.
I am looking for an entry.

EWC Long after consolidation in uptrendEnter EWC after breakout above recent highs with stop below recent lows


See all ideas
Summarizing what the indicators are suggesting.
Oscillators
Neutral
SellBuy
Strong sellStrong buy
Strong sellSellNeutralBuyStrong buy
Oscillators
Neutral
SellBuy
Strong sellStrong buy
Strong sellSellNeutralBuyStrong buy
Summary
Neutral
SellBuy
Strong sellStrong buy
Strong sellSellNeutralBuyStrong buy
Summary
Neutral
SellBuy
Strong sellStrong buy
Strong sellSellNeutralBuyStrong buy
Summary
Neutral
SellBuy
Strong sellStrong buy
Strong sellSellNeutralBuyStrong buy
Moving Averages
Neutral
SellBuy
Strong sellStrong buy
Strong sellSellNeutralBuyStrong buy
Moving Averages
Neutral
SellBuy
Strong sellStrong buy
Strong sellSellNeutralBuyStrong buy
Displays a symbol's price movements over previous years to identify recurring trends.
Frequently Asked Questions
An exchange-traded fund (ETF) is a collection of assets (stocks, bonds, commodities, etc.) that track an underlying index and can be bought on an exchange like individual stocks.
EWC trades at 45.86 USD today, its price has fallen −0.80% in the past 24 hours. Track more dynamics on EWC price chart.
EWC net asset value is 45.90 today — it's fallen 0.65% over the past month. NAV represents the total value of the fund's assets less liabilities and serves as a gauge of the fund's performance.
EWC assets under management is 3.07 B USD. AUM is an important metric as it reflects the fund's size and can serve as a gauge of how successful the fund is in attracting investors, which, in its turn, can influence decision-making.
EWC price has fallen by −0.76% over the last month, and its yearly performance shows a 18.50% increase. See more dynamics on EWC price chart.
NAV returns, another gauge of an ETF dynamics, have risen by −0.65% over the last month, have fallen by −0.65% over the last month, showed a 7.81% increase in three-month performance and has increased by 20.26% in a year.
NAV returns, another gauge of an ETF dynamics, have risen by −0.65% over the last month, have fallen by −0.65% over the last month, showed a 7.81% increase in three-month performance and has increased by 20.26% in a year.
EWC fund flows account for 32.04 M USD (1 year). Many traders use this metric to get insight into investors' sentiment and evaluate whether it's time to buy or sell the fund.
Since ETFs work like an individual stock, they can be bought and sold on exchanges (e.g. NASDAQ, NYSE, EURONEXT). As it happens with stocks, you need to select a brokerage to access trading. Explore our list of available brokers to find the one to help execute your strategies. Don't forget to do your research before getting to trading. Explore ETFs metrics in our ETF screener to find a reliable opportunity.
EWC invests in stocks. See more details in our Analysis section.
EWC expense ratio is 0.50%. It's an important metric for helping traders understand the fund's operating costs relative to assets and how expensive it would be to hold the fund.
No, EWC isn't leveraged, meaning it doesn't use borrowings or financial derivatives to magnify the performance of the underlying assets or index it follows.
In some ways, ETFs are safe investments, but in a broader sense, they're not safer than any other asset, so it's crucial to analyze a fund before investing. But if your research gives a vague answer, you can always refer to technical analysis.
Today, EWC technical analysis shows the sell rating and its 1-week rating is buy. Since market conditions are prone to changes, it's worth looking a bit further into the future — according to the 1-month rating EWC shows the buy signal. See more of EWC technicals for a more comprehensive analysis.
Today, EWC technical analysis shows the sell rating and its 1-week rating is buy. Since market conditions are prone to changes, it's worth looking a bit further into the future — according to the 1-month rating EWC shows the buy signal. See more of EWC technicals for a more comprehensive analysis.
Yes, EWC pays dividends to its holders with the dividend yield of 1.85%.
EWC trades at a premium (0.09%).
Premium/discount to NAV expresses the difference between the ETF’s price and its NAV value. A positive percentage indicates a premium, meaning the ETF trades at a higher price than the calculated NAV. Conversely, a negative percentage indicates a discount, suggesting the ETF trades at a lower price than NAV.
Premium/discount to NAV expresses the difference between the ETF’s price and its NAV value. A positive percentage indicates a premium, meaning the ETF trades at a higher price than the calculated NAV. Conversely, a negative percentage indicates a discount, suggesting the ETF trades at a lower price than NAV.
EWC shares are issued by BlackRock, Inc.
EWC follows the MSCI Canada Custom Capped. ETFs usually track some benchmark seeking to replicate its performance and guide asset selection and objectives.
The fund started trading on Mar 12, 1996.
The fund's management style is passive, meaning it's aiming to replicate the performance of the underlying index by holding assets in the same proportions as the index. The goal is to match the index's returns.