EWG trade ideas


Germany: 43 cent per share risk shortThis is a very, very tight stop loss short setup in the monthly EWG chart. If it confirms (which it might, due to the Deutsche Bank impending collapse), we could get confirmation during October.
We'd need price to stay clear from the 26.10 mark for the whole month, so we could use a stop at 26.11 without a problem here, or just trade it with options instead and exit if 26.11 is breached.
Interestingly enough, the SPX chart has a big uptrend that confirms if during October, we don't retest 2100, so, maybe we have a huge pair trade there: one fires an uptrend, the other a downtrend?
That would be a tremendous trade...
Good luck, hopefully they sort this DB problem without triggering a systemic crash, and if they do, we will be prepared.
Ivan Labrie.

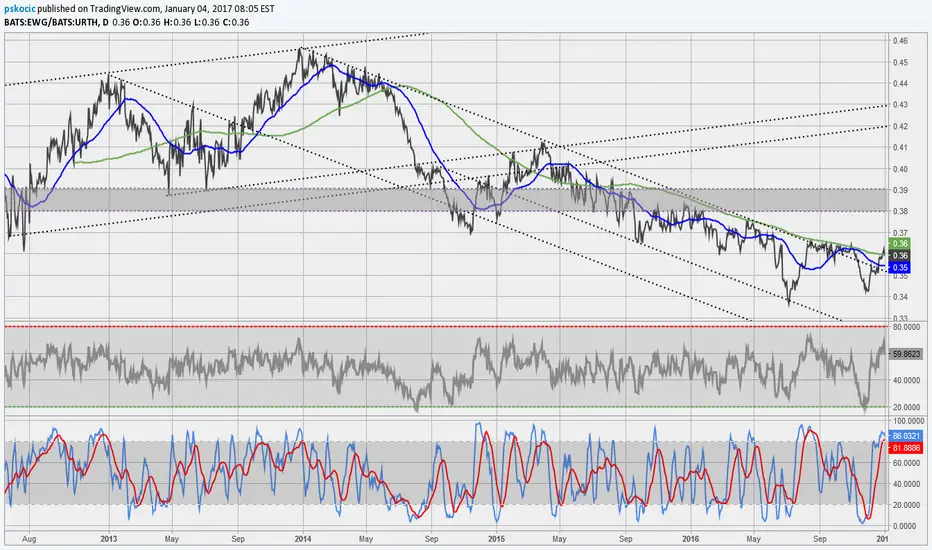
German I-Shares, Weekly: Longer Trend Looks LowerThis is chart 2 for the German-I-Shares. Chart one was for one hour time increments. This is weekly.
The RSI on a weekly basis is rolling over and will most likely head lower.
The 89 week moving average is heading down.
The price structure is trading inside the Ichimoku Cloud.
The Ichimoku Cloud is heading lower.
The Ichimoku Cloud also has a red border on top, indicating weakness.
What would convince me otherwise that an uptrend will start?
The down trend channel at $27.10 would have to be breached to the upside.
The prices would have to remain above the Ichimoku Cloud.
Good luck to you. Don.

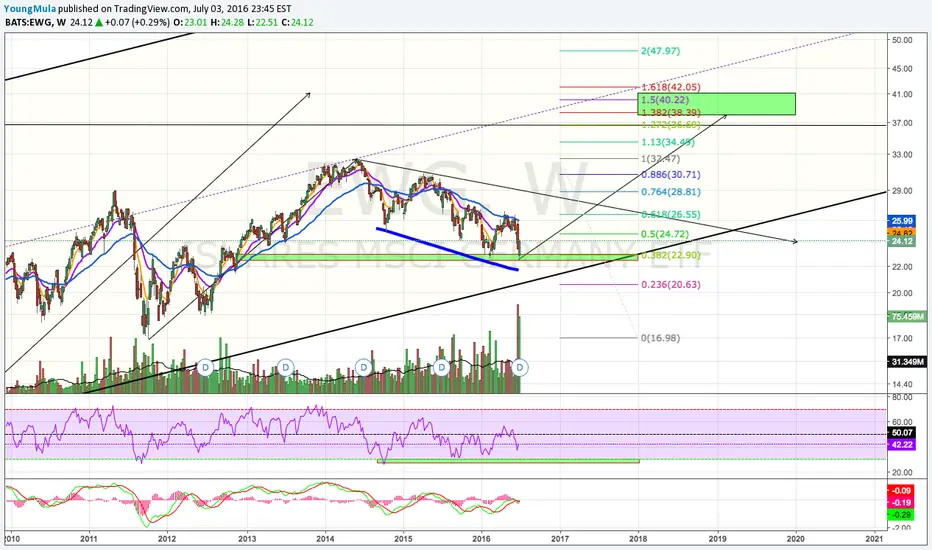
German Index: 5 Impluse Waves & 3 Corrective Waves (Twice)Since May, the German I-Shares have completed a 5 wave impulse pattern followed by a 3 wave a-b-c corrective pattern.
In late June this resulted in a selloff.
This pattern repeated itself for the second time this summer.
After the a-b-c corrective waves (ending August 15) EWG-has gone sideways.
I believe the path of least resistance is down.
My next chart is of Germany-I-Shares, only the time horizon will be weekly.
Good luck to you. Don.


EWG - DAX expressed in USDFractal from Jan-Sep 2015 is a good fit. We are now about 23 April 2015. Beware - the implication of a double top is in EWG, not DAX. EURUSD price/action must also be considered.


going to erase the drawings,print and hang this one over the bedThe german market is sporting a beaut of a wedge right now! This chart is so pretty, I kinda feel bad for drawing on it. There are many ways to take a potential profit due to the clean air on the left side of break out. One way is to use a simple median line. The great thing here is that the longer price uses to reach it, the higher the profit. With regards to the stop, the last swing low before the break out looks appealing.

EWG rising wedge.With the EURO rallying, look for countries that are major exporters to get hit. EWG has a classic bearish rising wedge, with negative MACD and RSI divergence.

EWG sees money flowing in - but very volatileAt the time I don't have EWG in my portfolio. But after the next correction it could be a hot candidate. Just my personal opinion, not a recommendation.
I hope the ETF world will publish a few leveraged ETFs on Germany.

EWG looks 23.5A break of the trendline spells trouble for the other markets that have held up well in the last year.
